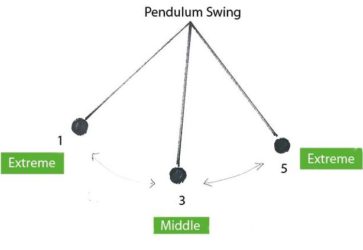
- Inflection points develop slowing, building like a kindling fire, before the flames erupt.
- Similar to a big ship, broad market inflection points take significant time.
- Price action continues to suggest that a major turning point is at hand, however, this has not been confirmed yet.
Intro Note From WTK
We have had two major inflection points in the broader markets in the past 20 years. Specifically 1999-2003, and 2007-2010. These years spanned dynamic changes in investment prices, with overvalued investments plunging while undervalued securities found a bid in both scenarios, and these selected years framed time spans where asset allocation and security selection really mattered. Right now, I think we are in the midst of our third major inflection point in the last 20 years.
Building on this narrative, prospective future real returns for developed market equities, specifically U.S. stocks and U.S. bonds, look more dire today than they did at the beginning of 2000 or 2008.
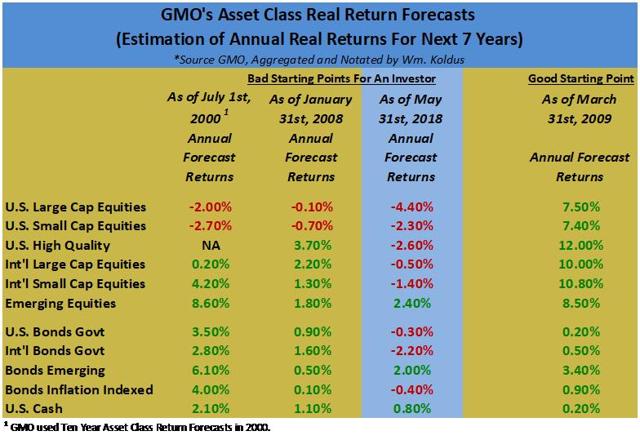
We can go back, with the benefit of hindsight, and make fun of, or objectively criticize firms like GMO all we want for their prior real return forecasts, however doing that (the criticizing) ignores that their forecasts, and others with a valuation bent, are based on an underlying valuation methodology, and valuation still matters in the end.
Put simply, starting from one of the highest starting points in market history in terms of valuations, adjusted for record profit margins, means that an investor today in U.S. stocks and U.S. bonds has very little probability of generating healthy future returns, until the starting point is more favorable. Going further, generating positive real returns over the next decade in the broader U.S. equity market may be a bigger challenge than many investors realize.
Adding to the narrative, it appears that we are in the midst of a secular turning point in bonds, as I have written about in-depth in my member Eye On The Bond Market series where the 35 plus year bond bull market is sovereign bonds came to an end in 2016.
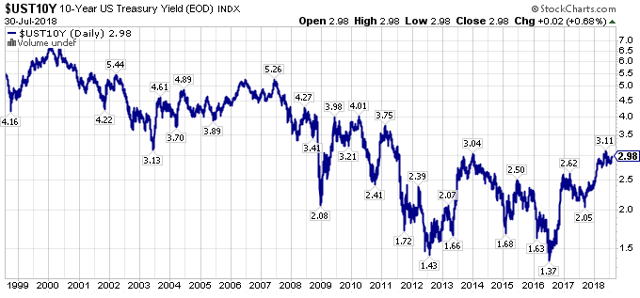 The bottom in bonds, which occurred in the middle of 2016, occurred after a bottom in commodity prices, which occurred near the beginning of 2016.
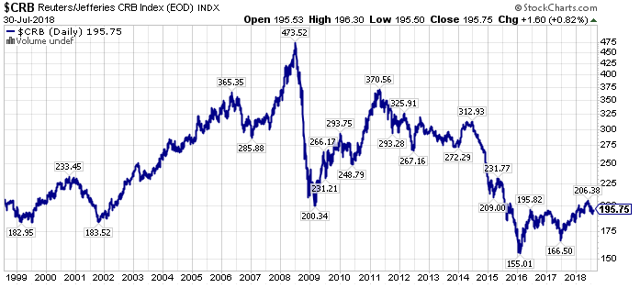 So far, the potential 2016 secular bottoms in commodity prices and sovereign bonds are acknowledged, however, they are not widely embraced, as there remains a lot of skepticism and pessimism among investors and speculators.
This pessimism and skepticism is prevalent, in part, because the market leaders during the length of the current bull market have remained in-favor, with notable strength in the FAANG and large-cap growth equities this year.
Building on this narrative, large-cap growth stocks are at the tail-end of a decade long run, so it would not be surprising for the top in the large-cap growth leaders to coincide with the top of the current equity bull market.
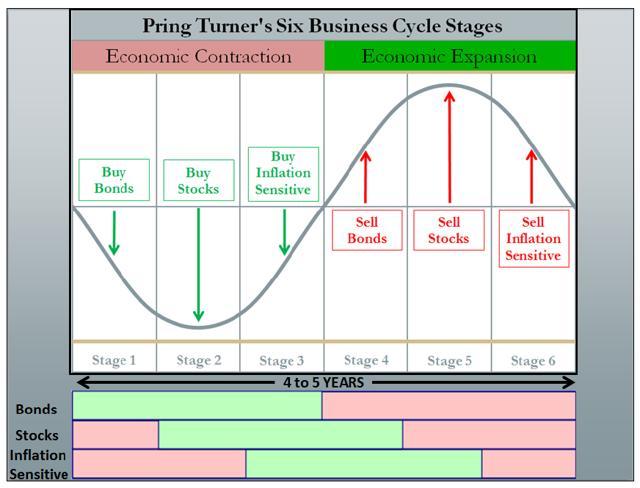 With bonds topping, equities are on the clock to top next, though given the dynamics of the current global business cycle, the topping process could be elongated to an extreme degree, a potential extension (on steroids) of the 2000 topping process.
Wrapping up this introduction, we should be in the sweet spot for inflation sensitive assets to outperform, and that has indeed been the case since January of 2016, yet right now, market leadership remains a clouded picture, so a majority of investors and speculators have not yet adapted to the new investing landscape.
In my opinion, that capital rotation recognition point is coming, and when it arrives, we should see even stronger price moves than we saw in the historic reversal and rebound in 2016.
FAANG & Large-Cap Technology Leadership – Beginning Of The End
Price action in the markets was interesting at the end of last week (when I started to write this article…I am now finishing it up Monday evening), and this interesting price action continued today. Could we be at the beginning of a long awaited capital rotation? Only time will tell.
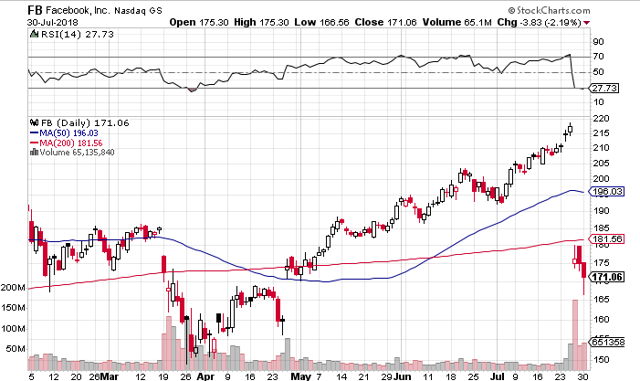
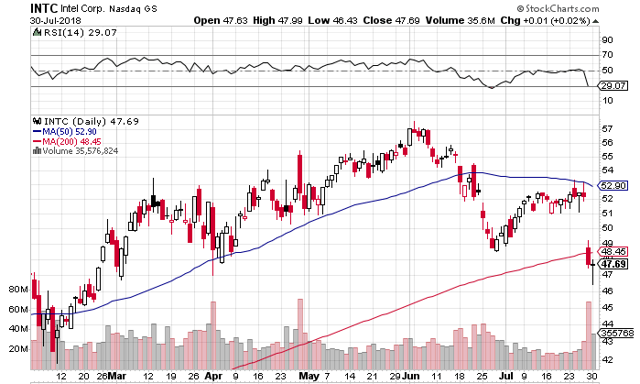
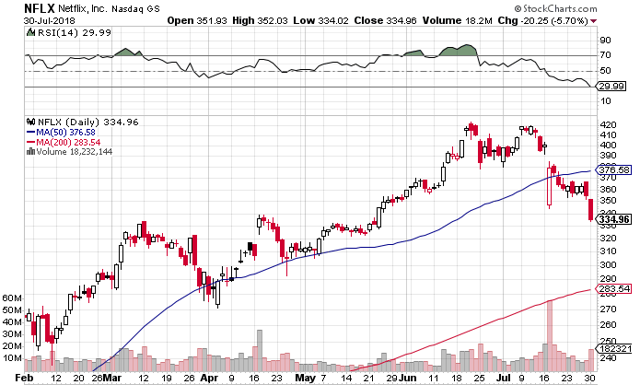
Last week, the S&P 500 Index (SPY), registered its 4th straight week of gains, but market leading stocks like Facebook (FB), Intel (INTC), Netflix (NFLX), and Twitter (TWTR) showed cracks in their armor.
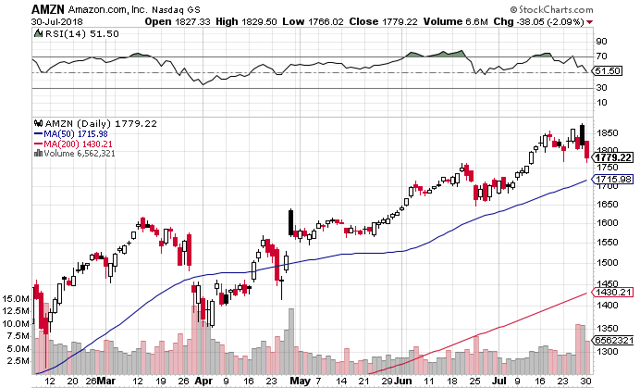
The selling pressure in the large-cap technology leaders escalated today, Monday, July 30th, as the following charts show.
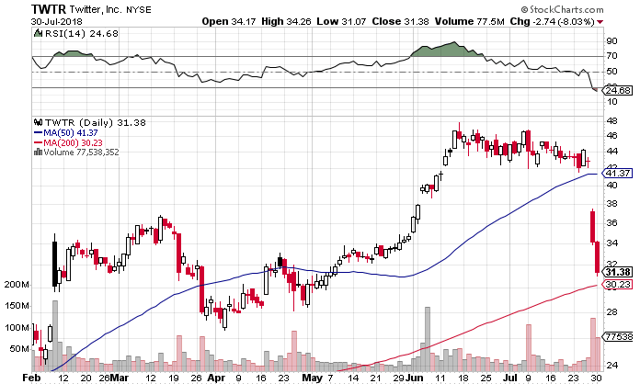 Year-to-date in 2018, FB is now down -3.1%, Intel is higher by 4.6%, Netflix is higher by a still remarkable 74.5% in 2018 (NFLX was higher by roughly 120% at one point), and TWTR is up by 30.7% YTD in 2018, after being higher by over 90% at its 2018 highs.
Three stocks have accounted for a substantial majority of the S&P 500’s 5.8% 2018 gain through Monday’s close.
These stocks are Amazon (AMZN), Microsoft (MSFT), and the aforementioned NFLX. AMZN’s shares are up 52.1% YTD through Monday’s close, and MSFT’s shares are higher by 24.3%.
AMZN and MSFT shares both remain in strong up-trends, thought the recent weakness in the NASDAQ, and in large-cap technology stocks, has hurt the relative strength of both equities.
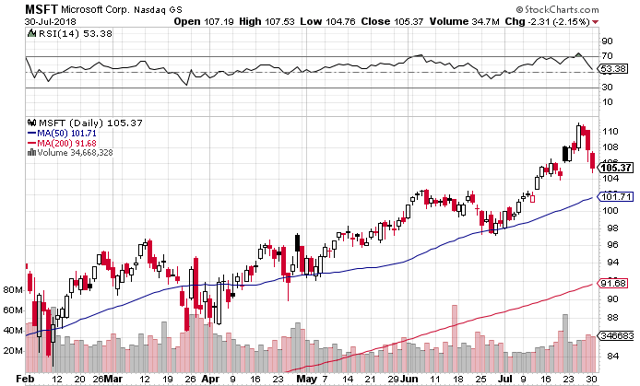 Ultimately, the Invesco QQQ Trust (QQQ) is still higher in 2018 by 12.9% as of this writing, down from its earlier 18% gains, yet still higher than the comparative return of the S&P 500 Index (up 5.8%) or the Dow Jones Industrial Average (DIA), which is up 3.4% in 2018 YTD.
Will 2018 resemble the technology peak of 2000?
There are certainly similarities, with loved market leaders that couldn’t possibly decline substantially (could they?), and a decade of growth out-performance in the rear view mirror.
Commodity Stocks Still The Intermediate-Term Leaders
As strong as FAANG equities, particularly Amazon and Netflix have been, they still trail the best performing commodity equities since the start of 2016, as the following chart illustrates.
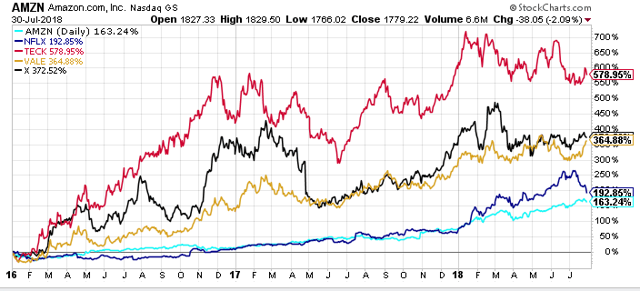 Stocks like Teck Resources Limited (TECK), which is Canada’s largest natural resource company, Vale (VALE), and U.S. Steel (X), have outpaced the performance of AMZN, and NFLX shares by a wide margin, which is saying something.
Now, not all commodity equities are up to the same degree, and some energy equities are even lower, however, this is a opportunity, in my opinion, as commodities, and commodity equities are the broader market’s performance leaders since the start of 2016.
The Takeaway – Commodity Stocks Remain Insanely Cheap On A Relative & Absolute Basis
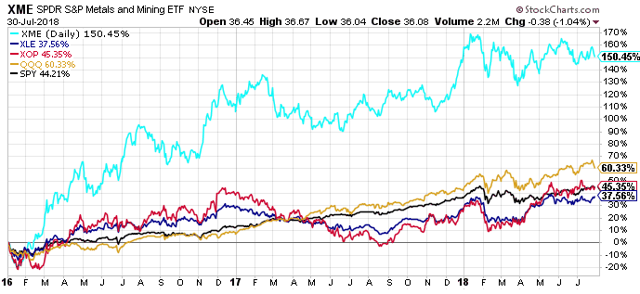
Despite the secular bottom in commodities, commodity equities, and sovereign interest rates in 2016, and the out-performance of commodity equities, particularly base metal stocks, as shown by TECK, VALE, and X earlier, and also by the SPDR S&P Metals and Mining ETF (XME), illustrated in the first chart below, since the start of 2016, commodity equities have struggled in the bigger picture.
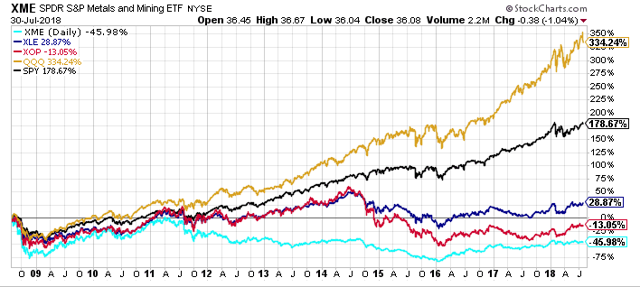
 Looking back over the past 10 years, the performance of XME, the Energy Select Sector SPDR Fund (XLE), and the SPDR S&P Oil & Gas Exploration & Production ETF (XOP), which have returned 28.9%, -13.1%, and -46.0% respectively, have dramatically trailed the performance of SPY and QQQ, which have delivered total returns of 178.7%, and 334.2% respectively.
 Widening the lens even further to 20 years, reveals something even more interesting.
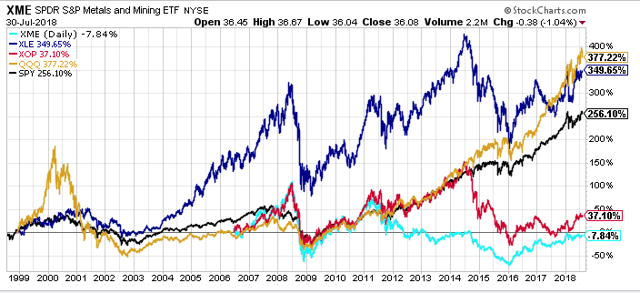 Specifically, the large-cap energy equities represented by XLE, think the Exxon’s (XOM) and Chevron’s (CVX) of the energy space, have kept pace with the QQQ, as XLE has returned 349.7% over the last 20 years, slightly trailing QQQ’s total return of 377.2%. Both have outpaced the S&P 500 Index, which has returned a not too shabby 256.1% total return over the last 20 years.
Thus, large-cap energy equities have excelled, while their smaller capitalization brethren, as represented by XOP, have struggled mightily, though the small-cap energy equities have outperformed the base metal and mining equities of the XME.
Looking at the performance data, there is a clear value delineation, ordered by market capitalization in the commodity equity universe.
This is why a stock like Southwestern Energy (SWN), which remains a top-five U.S. natural gas producer (and one of the most undervalued equities in the market today IMO), yet SWN has clearly been part of the Have Not group of equities, as evidenced by its market capitalization, or Cleveland-Cliffs (CLF), which I also believe remains very cheap on a relative and absolute basis, yet CLF shares remain extremely out-of-favor, remain so attractive.
These are the quintessential value stocks of today, the proverbial REITs of the late 1990’s.
It is easy to forget now, but entering the year 2000, technology stocks had ruled for the prior decade, and they started the year strongly.
Does that sound like the past decade to you?
It should.
What happened next. Well technology stocks topped in March of 2000, and the Russell 1000 Growth Index (IWF) went on to lose roughly -22% for calendar 2000, while the Russell 1000 Value Index (IWD), which had trailed in performance for the prior decade, actually delivered a positive return in the year 2000, gaining roughly 7%.
The performance difference was even greater in the smaller capitalization equities.
Value is due for a period of performance like this versus growth, and the key question is what are the best value stocks today.
Could the best value stocks actually be the downtrodden, out-of-favor commodity equities?
I think it is more likely than most market participants think.
Looking forward to a good discussion on this topic,
Travis

