2020 has been a year that will stand out in the history books. Financial markets have seen their own share of history in 2020, including significant inflection points, both those readily apparent, and those that have existed behind the scenes.
In the energy sector, March 9th, 2020 was a significant inflection point, where many energy equities, including Occidental Petroleum (OXY) declined over 50% in a single trading session, and alternatively, leading natural gas equities, including EQT Corp. (EQT), Cabot Oil & Gas (COG), and Southwestern Energy (SWN) actually finished higher amid the energy carnage, as I chronicled and outlined in the following two public articles.
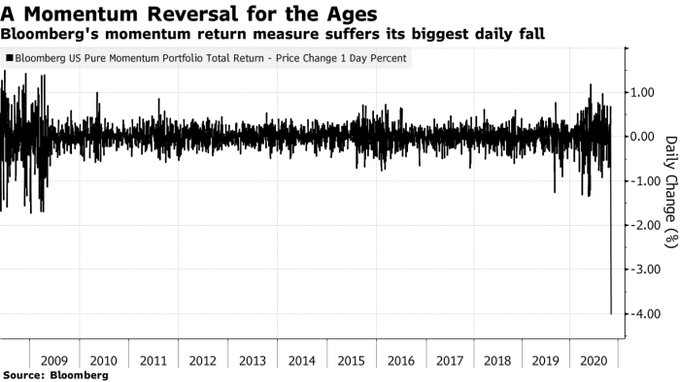
While natural gas equities have shined in the energy complex in 2020, energy stocks, and value stocks have generally continued to be out-of-favor, however, the inflection point might have been reached on November 9th, 2020.
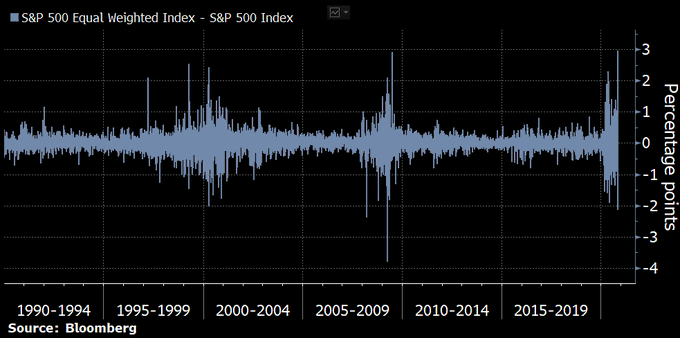
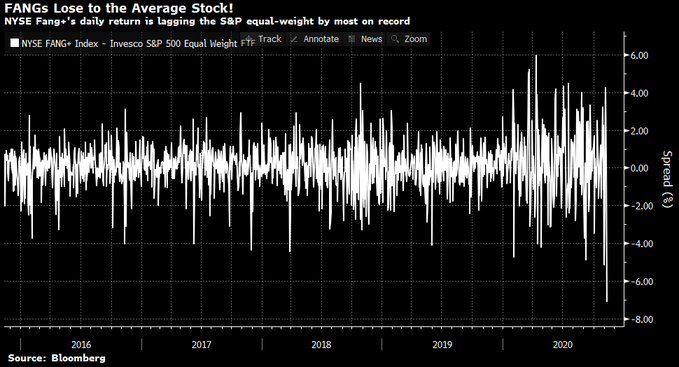
A Record Change In The Relative Performance Of Momentum Stocks Occurred On November 9th, 2020.S&P 500 Equal Weight ETF (RSP) Had Its Best Relative Performance Day Versus SPDR S&P 500 ETF (SPY) Ever On November 9th, 2020!FAANG Stocks Had Worst Relative Performance Day Since Acronym Gained Popularity On November 9th, 2020!
Takeaway Thoughts
Sometimes an inflection point is obvious, hitting an observer over the head, and sometimes it is more discreet, requiring some time to appreciate what has transpired. With energy stocks, which are the fulcrum of the value opportunity, continuing to outperform this past week ending Friday, November 20th, 2020, including the Energy Select SPDR Fund (XLE) rising 5.7%, the SPDR S&P Oil & Gas Exploration & Production ETF (XOP) rising 6.6%, and the VanEck Vectors Oil Services ETF (OIH) rising 10.9%, while the SPDR S&P 500 ETF (SPY) declined 0.8%, and the Invesco QQQ Trust (QQQ) declined 0.2%, market participants may look back to November 9th, 2020, and view it as a line of demarcation between the “Have’s” and the “Have Not’s”.
This has been my focus for a number of years, which has been to my detriment overall thus far, though 2020 seems to be the turning point, something I have referred to as the “Main Course” to 2016’s “Appetizer”.
A lot of analysts talk about historic opportunity in the markets when discussing stocks or portfolio strategy, yet this is “the real McCoy”.
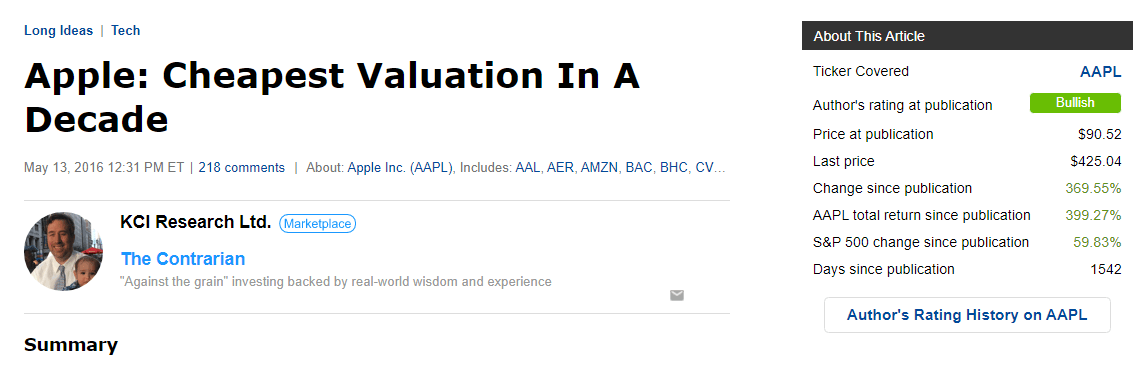
On May 13th, 2016, I wrote a public Seeking Alpha article stating that Apple was trading at its cheapest valuation in a decade.
The total return for AAPL shares since that articles publication was close to 400%, with the S&P 500 Index up roughly 60% over this time frame.
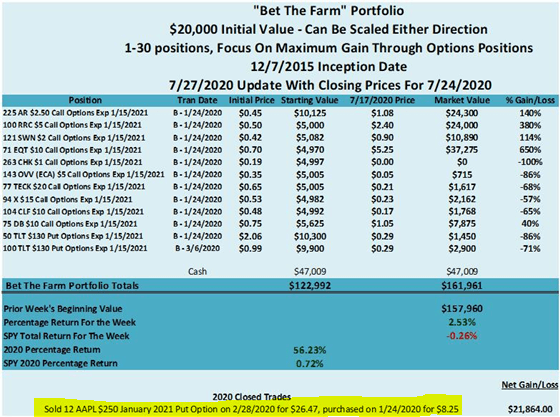
In 2020, I have been more bearish on AAPL shares, securing a 221% gain on AAPL puts, with a February 28th, 2020 closing transaction.
That first sale of the put options was too early, given the melt-down the broader equity markets suffered over the course of March of 2020.
Today is a perfect time to use Apple as a market hedge on the short side, again, as its enormous market capitalization and elevated price-to-sales-ratio will make it hard for shares to move higher going forward.
“I will go to my grave… believing that really loose monetary policy greatly contributed to the Financial Crisis. There were obviously problems with regulation, but when we had a 1% Fed Funds rate in 2003 after, to me, it was pretty obvious that the economy had turned (up) and I think the economy was growing at 7% to 9% nominal in the fourth quarter of 2003 and that wasn’t enough for the Fed. They had this little thing called ‘considerable period’ on top of the 1% rate just so we would make sure that their meaning was clear. And it was all wrapped around this concept of an insurance cut… I’ve made some money predicting boom-bust cycles. It’s what I do. Sometimes I am right. Sometimes I am wrong, but every bust I had ever seen was proceeded by an asset bubble generally set up by too loose policy…”– Stanley Druckenmiller
(Source: Image From Author’s May 2016 Seeking Alpha Apple Article)
Introduction
On May 13th, 2016, I wrote a public Seeking Alpha article stating that Apple (AAPL) was trading at its cheapest valuation in a decade. The total return for AAPL shares since that article’s publication was close to 400%, with the S&P 500 Index up roughly 60% over this time frame.
(Source: Author, Seeking Alpha)
More recently, I have turned somewhat bearish on AAPL shares, especially as the company has continued its climb towards the $2 trillion market capitalization mark.
In fact, earlier this year, I purchased January 2021 puts on Apple shares, and then on February 28th, 2020, I cashed these puts in for a 221% gain, which was too early with the benefit of hindsight, even though I wrote publicly about the risks of COVID-19, including this article, titled “Two Black Swans“, which was published on Seeking Alpha on February 25th, 2020.
Alternatively, you could say I cashed in at a decent time, given the broader stock markets seemingly parabolic rise from its March 23rd, 2020 lows, which has been led by the largest market capitalizations stocks, including Amazon (AMZN), Microsoft (MSFT), Alphabet (GOOGL), (GOOG), Facebook (FB), and of course, Apple.
Whatever logic you subscribe to, I think it is a perfect juncture to take a bite out of Apple shares on the short side again.
Why?
I feel this way for three reasons. First, the company’s sheer size and elevated price-to-sales ratio is going to make it hard to grow robustly going forward, secondly, on a broader valuation basis, shares are no longer cheap, like they were in May of 2016, and third, market participants are using the leading growth stocks as a bet on continued disinflationary pressures amdist the COVID-19 pandemic, yet some combination of a vaccine, treatments, or herd immunity is likely to usher in a historic capital rotation towards value equities and economically sensitive equities.
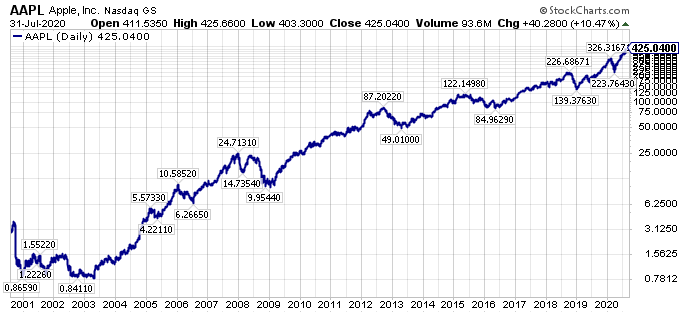
Apple’s Sheer Size Is A Headwind
Apple’s market capitalization at Friday, July 31st, 2020’s closing price of $425.04 is a remarkable $1.84 trillion. In fact, with a 10.47% share price gain during Friday’s trading session, Apple shares added over $174 billion dollars in market capitalization.
Breaking this down further, that $174 billion gain in market capitalization, if ascribed to one company, would make that hypothetical company roughly the 35th largest company in the SPDR S&P 500 ETF (SPY).
For perspective, the market capitalization of Pepsico (PEP) is $191 billion, the market capitalization of Abbot Laboratories (ABT) is $178 billion, the market capitalization of Saleforce.com (CRM) is $176 billion, the market capitalization of Oracle Corporation (ORCL) is $170 billion, and the market capitalization of AbbVie (ABBV) is $167 billion.
Again, for perspective, Apple gained roughly the amount of market capitalization in a single day, that some of the largest companies in the S&P 500 Index have taken lifetimes to build.
Overall, AAPL shares now compromise roughly 6% of the S&P 500 Index (SP500), and with Friday’s move, they should surpass Microsoft as the venerable index’s largest holding, which will be mirrored in State Street Corporations (STT) SPY product.
The problem with being this enormous, is that Apple is going to have a hard time growing revenues, profits, and cash flows at a rate that make a material impact on the overall size of the enterprise.
Building on this narrative, at a trailing-twelve-month revenue run rate of $274 billion, Apple is selling at an almost 7x revenue multiple for the past twelve months, and revenue has not really grown at all from 2018’s annual levels ($266 billion).
On this note, given this price-to-sales multiple, we have to remember what Scott McNealy, the former CEO of Sun Microsystems said about his company trading at a 10x revenue multiple at the peak of the dot-com bubble era.
‘At 10 times revenues, to give you a 10-year payback, I have to pay you 100% of revenues for 10 straight years in dividends. That assumes I can get that by my shareholders. That assumes I have zero cost of goods sold, which is very hard for a computer company. That assumes zero expenses, which is really hard with 39,000 employees. That assumes I pay no taxes, which is very hard. And that assumes you pay no taxes on your dividends, which is kind of illegal. And that assumes with zero R&D for the next 10 years, I can maintain the current revenue run rate. Now, having done that, would any of you like to buy my stock at $64? Do you realize how ridiculous those basic assumptions are? You don’t need any transparency. You don’t need any footnotes. What were you thinking?’
Now Apple is not Tesla (TSLA), which sports a price-to-sales ratio over 10 (though to be fair to Tesla, revenues could surge higher on higher vehicle volumes), however, with Apple’s revenue growth already slowing to a crawl, and the sheer size of Apple’s revenues being so large, it is going to be hard to grow revenues and profits to simply maintain the company’s stock price anywhere near today’s levels, let alone grow it, at least in my opinion.
Apple’s Valuation Ratios Today Are Head & Shoulders Above Where They Were In May Of 2016
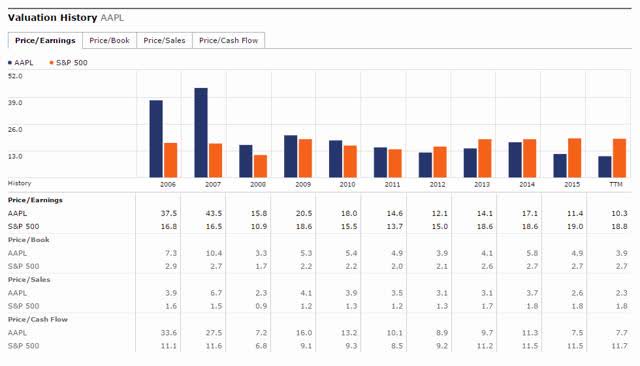
Remember, we just established that Apple shares are trading for almost a 7x price-to-sales multiple, with very little revenue growth the past two years. Building on this narrative, the valuation table image below, with underlying data from Morningstar (MORN), is taken directly from my May of 2016 public article.
(Source: Author’s May 2016 Article, Seeking Alpha, Morningstar)
Notice that back in May of 2016, Apple shares were trading at 2.3 times price-to-sales multiple, a 10.3 times price-to-earnings ratio, and a 3.9 times price-to-book ratio.
Today, those valuation multiples for Apple are 6.9 for the price-to-sales multiple, 32.2 times for the price-to-earnings multiple, and 25.2 times for the price-to-book multiple.
(Source: Morningstar)
Given these extended valuation ratios, it should be no surprise that Morningstar had a $285 fair value target on AAPL shares as of July 31st, 2020, which is a tidy 32.9% below Apple’s recent closing price.
Growth Stocks Could Be Hurt In A Capital Rotation
It has already been established that Apple is a growth stock without revenue growth, as their trailing-twelve-month revenues of $274 billion are only modestly above their 2018 fiscal year revenues of $266 billion and their 2019 fiscal year revenues of $260 billion.
This flat-line in growth is decidedly different than their large-cap growth peers. On that note, an analyst can say whatever they want about Alphabet, Amazon, Facebook, and Microsoft, and some of these companies are ridiculously overvalued too, in my opinion, however, at least these companies are firmly growing revenues.
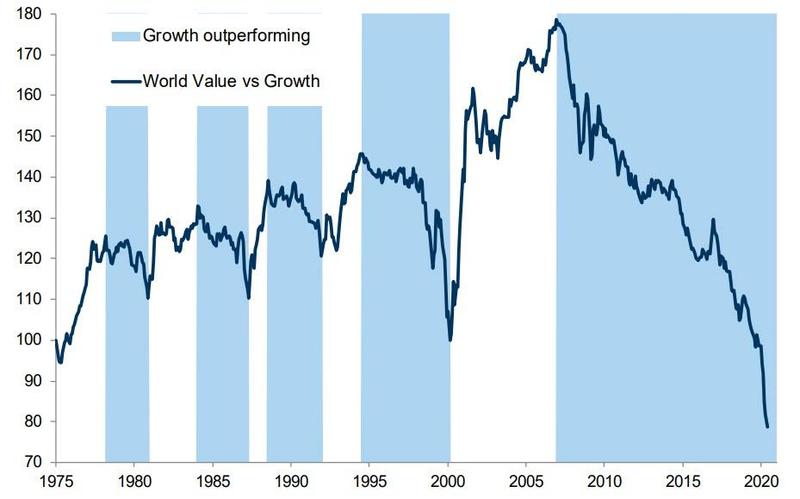
Building on this narrative further, we know that growth stocks have outperformed their value counterparts for the better part of 13 years now.
(Source: Nomura)
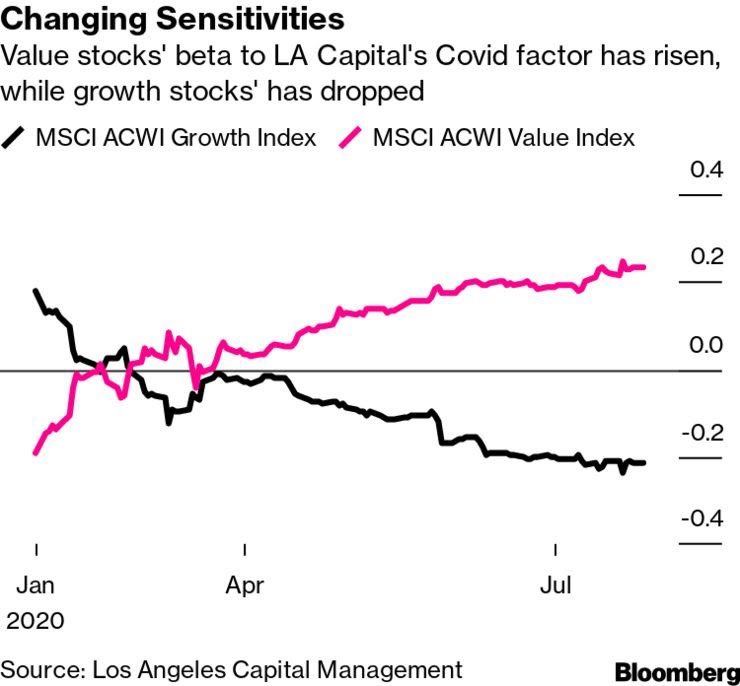
This outperformance has grown amidst the COVID-19 outbreak, with growth stocks actually less sensitive to asset manager’s modeled COVID factors than their value peers.
(Source: Los Angeles Capital Management)
This makes sense as many of the leading growth stocks like Amazon, Netflix (NFLX), and Shopify (SHOP) have actually benefited, on both a relative and absolute basis, from the lifestyle changes that COVID-19 has engendered.
Apple has fit firmly into this camp, with shares making new all-time highs, as they have gotten a revenue boost from more employees working from home, and the resulting technology spending.
The fly in the ointment here is that Apple is really not a growth stock these days, even with their recent quarterly earnings that came in better than expectations, so it has been lumped in with the positive leading growth stock beneficiaries of the COVID-19 pandemic, yet Apple has not yet seen a commiserate, sustainable boost in their business, at least on the same percentage terms as some of their peers.
For example, Amazon is Apple’s closest peer in terms of market capitalization, and Amazon reported earnings on the same day as Apple, and the company topped their consensus revenue estimates by roughly 10% for the second quarter of 2020, showing overall revenue growth of 40% year-over-year that dwarfed their larger capitalization rival, with Apple reporting 11% revenue growth year-over-year.
Closing Thoughts – Apple Is A Terrific Company That Is Significantly Overvalued
Back in May of 2016, I could not say enough good things about Apple’s stock from a value perspective. Today, with Apple’s price-to-sales, price-to-earnings, and price-to-book multiples all significantly higher than they were in 2016, and with the company showing a lack of revenue growth the past three years, I am much more skeptical on shares.
So skeptical, in fact, that I purchased Apple January 2021 puts on January 24th, 2020, and then took a 221% gain on these a few weeks later.
(Source: The Contrarian)
With Apple shares climbing even higher in the summer of 2020 than they were earlier in the spring of 2020 before the COVID-19 outbreak, I think now is the ideal time to use a short position again in Apple shares as a hedge against a broader market decline. This hedge serves dual purposes for me personally, which are protecting my long positions, and guarding against a capital rotation where in-favor stock like Apple are sold, and out-of-favor stocks that are undervalued, like Antero Resources (AR) that I profiled recently here, appreciate.
Given how overvalued Apple shares are today compared to where they were in 2016, it is also possible that Apple’s common stock underperforms the market, and even declines on an absolute basis, irrespective of the broader markets overall direction.
The possibility of outright declines in Apple’s common shares seems farfetched now, with the afterglow of Apple’s recent multi-year bullish performance fresh in investors’ minds, however, we only have to look back to the first half of 2016 to see an environment where Apple’s stock was out-of-favor.
Shares do not have to go all the way back to their May 2016 levels of $90 per share for current Apple investors to suffer, as simply going back to Morningstar’s fair value target of $285 would imply an outright decline of roughly 33% below Apple’s closing price on Friday, July 31st, 2020.
Wrapping up, without a doubt, Apple has been one of the most remarkable growth stories in U.S. business, particularly over the past two decades. Personally, over the last decade, I have owned Mac’s, iPod’s, iPad’s, iPhone’s, and Apple common shares, so you could even say I am a connoisseur of Apple’s products.
Common shares have appreciated by roughly 500x from their 2000-2002 lows, propelling Apple to become the largest market capitalization stock in the world. Whether you own Apple shares outright or not, most investors have an implicit stake in the company, because Apple has a roughly 6% weighting in the S&P 500 Index and a roughly 12% weighting in the Invesco QQQ Trust (QQQ).
The significant weightings in benchmark indexes are a result of historic run of growth, and many traders front running valuation insensitive and price insensitive index/ETF buying, however, Apple’s revenue growth has slowed and stalled, and its once formidable free cash flow yield (the company generated over $66 billion in FCF in the past twelve months) has shrunk to under 4% as its market capitalization has ballooned. Apple remains a fine company, just an expensive one on a valuation basis, and this poor valuation starting point is a recipe for poor future stock returns.
Disclosure: I am/we are short SPY in a long/short portfolio, I plan on shorting AAPL shares again via put options in the next 72 hours, and I am long AR.
Additional disclosure: Every investor’s situation is different. Positions can change at any time without warning. Please do your own due diligence and consult with your financial advisor, if you have one, before making any investment decisions. The author is not acting in an investment adviser capacity. The author’s opinions expressed herein address only select aspects of potential investment in securities of the companies mentioned and cannot be a substitute for comprehensive investment analysis. The author recommends that potential and existing investors conduct thorough investment research of their own, including detailed review of the companies’ SEC filings. Any opinions or estimates constitute the author’s best judgment as of the date of publication and are subject to change without notice.
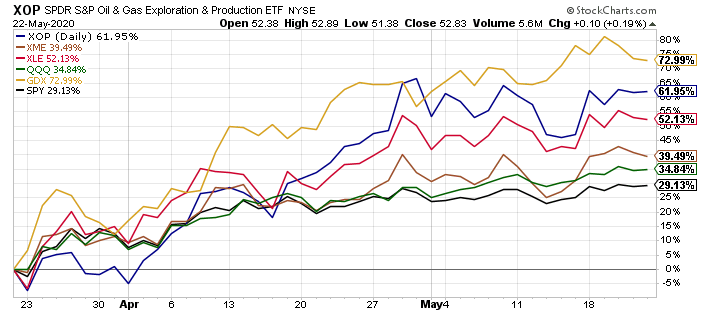
The broader equity market bottomed on March 23rd, 2020, and since then the SPDR S&P 500 Index ETF (SPY) is higher by 29.1%, and the Invesco QQQ Trust (QQQ) is higher by 34.8%, as shown in the chart below.
Somewhat inconspicuously, precious metals equities, as measured by the VanEck Vector Gold Miners ETF (GDX), have risen 73.0% since the March 23rd broader market low, energy equities, as measured by the Energy Select Sector SPDR Fund (XLE) and the SPDR S&P Oil & Gas Exploration & Production ETF (XOP), have risen 52.1% and 62.0%, respectively, from the March 23rd broader market low, and basic material stocks, as measured by the SPDR S&P Metals & Mining ETF (XME), which have risen 39.5% since the March 23rd broader market low.
Said another way, inflation sensitive and economically sensitive equities are quietly outperforming.
At the time of this publication, I was routinely mocked, much as I was in 2008 and 2009, before this happened.
How did I achieve this performance?
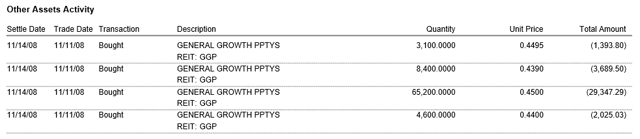
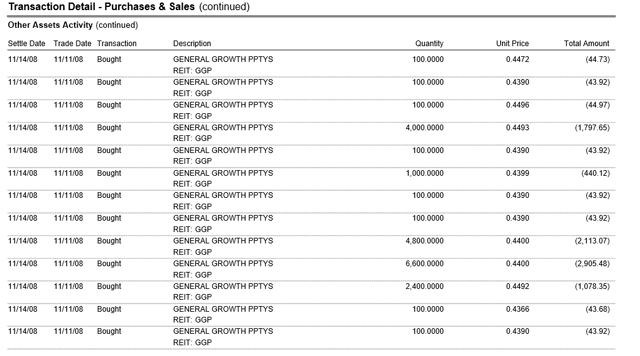
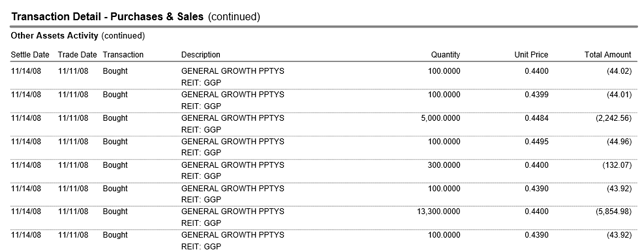
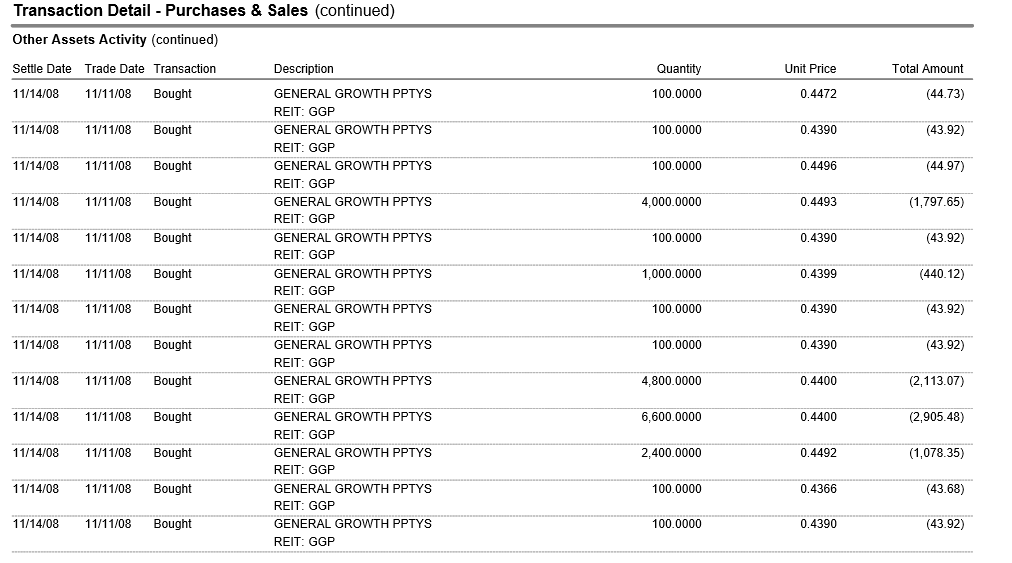
Simply put, it was buying undervalued equities, like General Growth Properties, in November of 2008, that almost nobody else wanted.
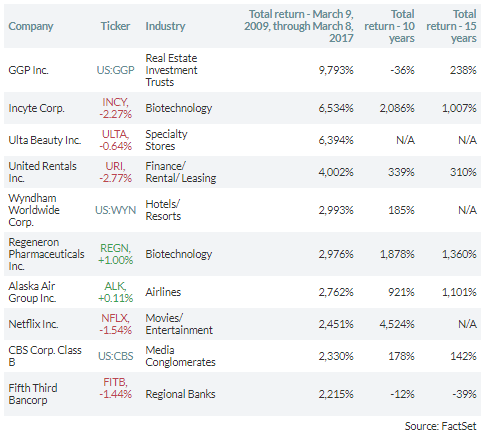
As I have said previously, these purchases, in aggregate, totaled $53,593.71, which was not a big dollar total in aggregate, however, the 120,000 shares were a nice stake in what would become the best performing S&P 500 equity in the bull market, at least through March 10th, 2017, as this CBS MarketWatch article on the bull market turning 8 years old chronicled.
In March of 2018, in the Brookfield Property Partners deal, these shares could be exchanged for $23.50 in cash.
Not a bad return at all, however, the key was to buy into the panic. That is the same thing we have done this time, and now we will see if the proverbial Main Course plays out in front of our eyes.
Best of luck to everyone. Stay healthy, safe, and happy,
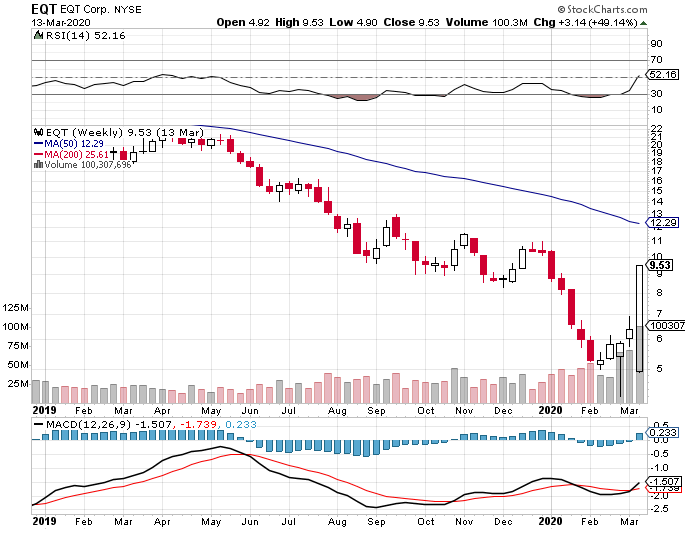
EQT Corp, the largest dry natural gas producer in the U.S., gained 49.1% last week.
Many natural gas equities had stellar performance weeks, while SPY dropped 9.5%, and historic volatility engulfed the markets.
Looking through the volatility, the inflection point is clearly at hand.
Introduction
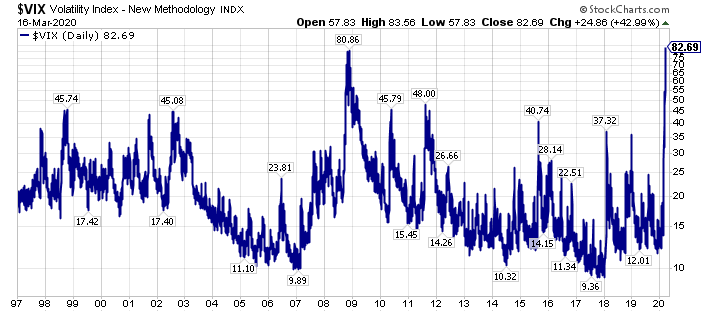
There has been historic volatility in the financial markets. That is not hyperbole, as the chart of the $VIX shows below.
In fact, even though the SPDR S&P 500 ETF (SPY) declined 9.5% last week, we have seen daily price moves, on a regular basis, that exceed that move.
In this swirling sea of turmoil, one sector that I have extremely bullish on stands out.
Specifically natural gas, and more specifically, the historically downtrodden natural gas equities, which have both been contrarian trades and investments even for contrarians.
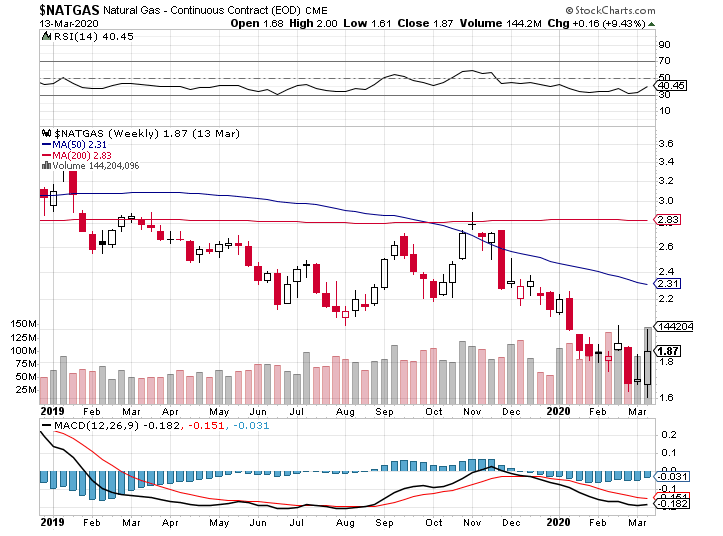
Dry natural gas prices rose 9.4% last week, the United States Natural Gas Fund (UNG) rose 10.7% last week, and the largest dry natural gas producer in the United States, EQT Corp (EQT), rose 49.1% last week.
Macro Is Turning Sharply To Favor Natural Gas
Anybody that has been reading my work knows that I have been extremely bullish on natural gas prices and natural gas equities.
Why?
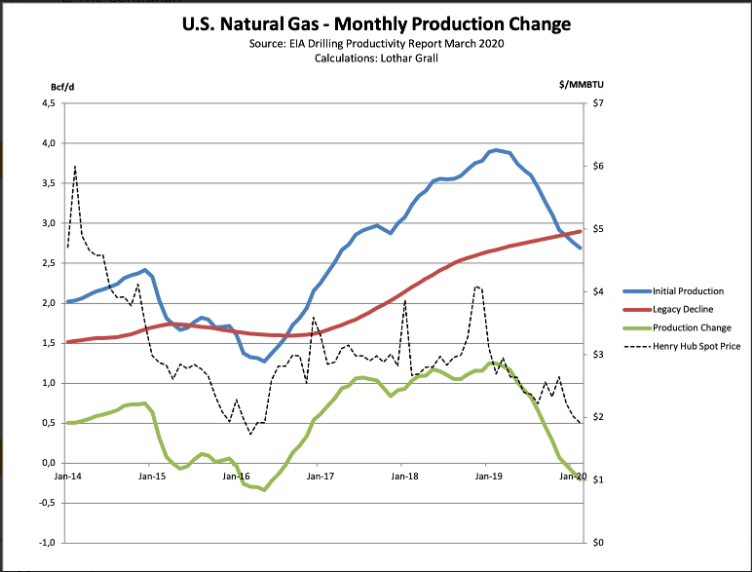
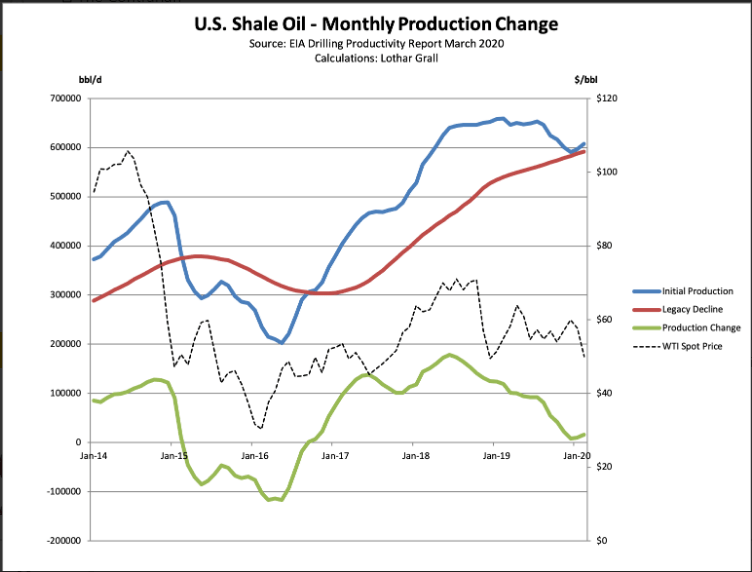
In a nutshell, both lower 48 dry natural gas production and liquids production are rolling over, as the charts of my colleague Lothar Grall illustrate.
(Source: Lothar Grall, The Contrarian)
Keep in mind, this data is from the EIA’s Drilling Productivity Report, and production was already in decline for dry natural gas and rolling over for liquids before COVID-19 became a full blown pandemic, and Russia and Saudi Arabia got into a full scale oil war.
The latter has cratered crude oil prices, and effectively rendered obsolete the primary bearish natural gas thesis, which was that unending associated dry gas production growth would forever impair dry natural gas prices.
Natural Gas Equities Have A Contrarian Surge
Again, last week, with the SPDR S&P 500 Index down 9.5%, the largest natural gas producer in the United States, EQT Corp (EQT), surged higher by 49.1%.
That is a monumental move, in a week of historical market volatility, and adding to the narrative, many of the leading dry natural gas producers had a strong week of relative, and absolute, price performance.
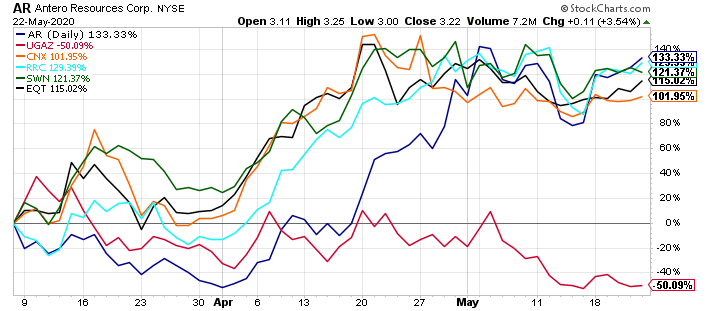
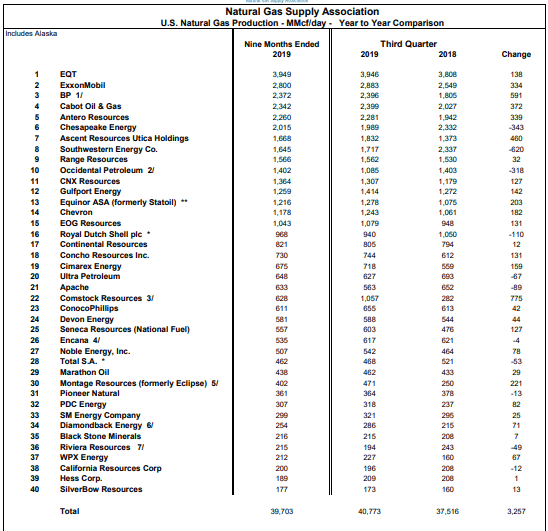
As this narrative begins to flow through to market participants, there is potential for extraordinary gains, perhaps even a generational wealth opportunity, as I wrote about in an article highlighting Antero Resources (AR) recently, in some of the largest dry natural gas producers in the table above.
On this note, much beleaguered Exxon Mobil (XOM), which is widely ridiculed for their XTO energy purchase in 2009, which gave them greater natural gas exposure, could get a material, unexpected (by many market participants) boost from higher dry natural gas prices.
Closing Thoughts – Take Advantage Of What I Think Is A Historic Opportunity
Many always ask me how I had a year like I did from November of 2008 to November of 2009.
The answer was really simple.
1. Have an accurate bigger picture macroeconomic view.
2. Identify opportunities that are mispriced by the markets.
3. Take advantage of the panic selling.
Fortunately, for market participants today, we have all the ingredients necessary for one of the great contrarian inflection points of all-time.
For members of my research services, I have published several recent pieces quantifying the historical volatility and the opportunity as follows:
(Note: Members can click on these articles to access. Also, the first article is still being distributed).
Somewhat unbelievably, we have had three historic days in the stock markets in the past six trading sessions, really four historic days counting Friday’s big gains, so the volatility is incredible.
Seeing through all of this volatility, there are clear inflection points at hand, and the relative and absolute opportunity right now is as big as I have seen in my 25 year plus personal and professional investment career.
In summary, buy what is cheap, and buy into the panic, as the cheapest valuation equities with the best future return prospects will often rebound ahead of a bottom in the broader equity market.
Specific to my research services, I am offering a 20% discount to membership (I am extending this through March) to “The Contrarian” (past members can also direct message me for a special rate), the lowest price point since the founding members price, where we have a live documented history dating back to late 2015.
Additionally, I am offering a limited time 50% discount for the first 10 new members (I expect these slots, some of which I view as a stepping stone to “The Contrarian”, to fill up fast as they have done previously) to a host of research options, including a lower price point. If you subscribe to a premium option (I have had one concierge slot open up), I will set-aside time for a personal phone call to get up to speed. To get these offers, go here, and enter coupon code “opportunity” without the quotes. Either way, once you sign up, I will follow-up with a welcome email within a day.
Reach out with any questions via direct message (I enjoy the dialogue at market inflection points).
Via my research services, or another avenue, please do your due diligence, and take advantage of what I believe is a historic inflection point, which I believe will supersede 2000-2002 in the growth-to-value rotation.
Disclosure: I am/we are long AR, EQT, UNG, XOM, and short SPY in a long/short portfolio.
Additional disclosure: Every investor’s situation is different. Positions can change at any time without warning. Please do your own due diligence and consult with your financial advisor, if you have one, before making any investment decisions. The author is not acting in an investment adviser capacity. The author’s opinions expressed herein address only select aspects of potential investment in securities of the companies mentioned and cannot be a substitute for comprehensive investment analysis. The author recommends that potential and existing investors conduct thorough investment research of their own, including detailed review of the companies’ SEC filings. Any opinions or estimates constitute the author’s best judgment as of the date of publication, and are subject to change without notice.
Panic selling in the broader stock market may have just begun.
Under the surface, panic selling has been ongoing in selected sectors and stocks for an extended period of time.
This presents the historic opportunity.
Introduction
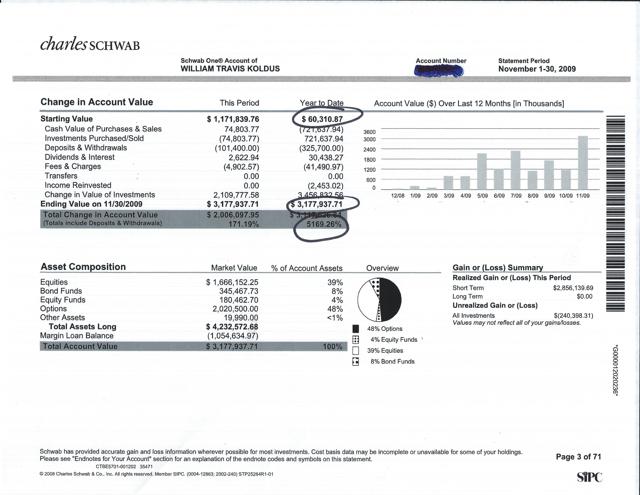
Often, I get the question of how I have achieved out-sized returns (and losses) in the past, particularly with an emphasis on what I have been able to do in my very good years, including 2016, 2003, 1999, 2000, 2008, 2010, and most notably 2009, as illustrated by the snapshot of an aggressive Portfolio that I managed personally for myself below, where I took roughly $60,000 in November of 2008 to over $3 million by November of 2009.
How did I achieve the above returns, over 5000% in a years time (which BTW I may never top, however, knowing this reality, does not stop the pursuit of good years, particularly at inflection points)?
There is a lot of complexity in the answer, including having a variant view, specifically on the broader market as measured by the S&P 500 Index (SPY), using some leverage to express this view, primarily via options, which can be very dangerous tools in inexperienced hands, and the willingness/ability to go against the grain.
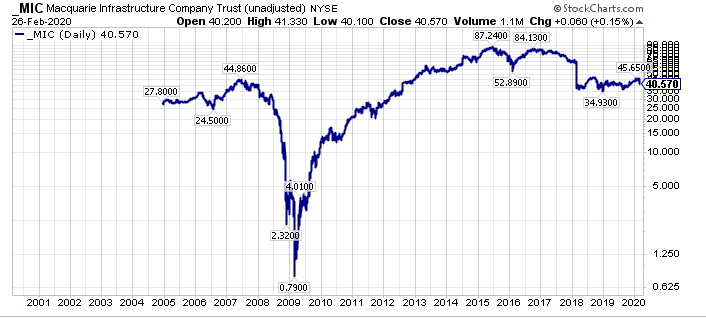
Having said this, there is also a lot of simplicity in the answer, specifically in the main underlying driver of the returns, which was buying significantly out-of-favor equities, with one example being my March 2009 and April 2009 purchases of Macquarie Infrastructure (MIC) for roughly $2 a share. Famously, MIC got down to $0.79 (before dividend adjustments…so I was down roughly 60% on even what I thought were bottom ticking purchases…think about that for a minute) and topped $80 per share, again before dividend adjustments, while also reinstating a substantial dividend, that has been roughly $1 per quarter for some time now (this dividend had been suspended in 2009 before being reinstated).
Clearly, with the benefit of hindsight, purchasing MIC at the lows was a generational investment opportunity, however, it was not easy at the time, even though I had done thousands of hours of due diligence on the company, similar to the focused due diligence effort I have done today, on out-of-favor, undervalued securities.
The key was buying into the panic selling, taking advantage of the panic, and I think we are seeing similar levels of opportunity today, just not in the places that most investors want to look.
Buying Into The Panic
In my November 2008 to November 2009 example above, I actually started buying what I felt were the most distressed, highest return potential candidate equities in 2008, in the heart of the panic. Remember, the broader equity market did not bottom until March of 2009, which is a whole other story, however, the important point is that some of the most downtrodden equities made their lows prior to the broader market making its lows.
One specific example, is General Growth Properties, the former second-largest mall REIT in the U.S. behind Simon Property Group (SPG), that was eventually acquired by Brookfield Property Partners (BPY) in 2018.
In November of 2008, I was on a due diligence trip through South Florida, meeting with hedge fund managers, and asset managers, and after a legendary night out for this generally non-party owl author (ask me for details if you want), I awoke in my Miami Beach hotel room, looking out at the ocean, and taking in the panic, eventually buying 120,000 shares of GGP on November 14th, 2018 for this specific account, as my brokerage account statement shows (if you want additional details send me a direct message).
These purchases, in aggregate, totaled $53,593.71, which was not a big dollar total in aggregate, however, the 120,000 shares were a nice stake in what would become the best performing S&P 500 equity in the bull market, at least through March 10th, 2017, as this CBS MarketWatch article on the bull market turning 8 years old chronicled.
In March of 2018, in the Brookfield Property Partners deal, these shares could be exchanged for $23.50 in cash.
Not a bad return at all, however, the key was to buy into the panic.
Where Is The Panic Today
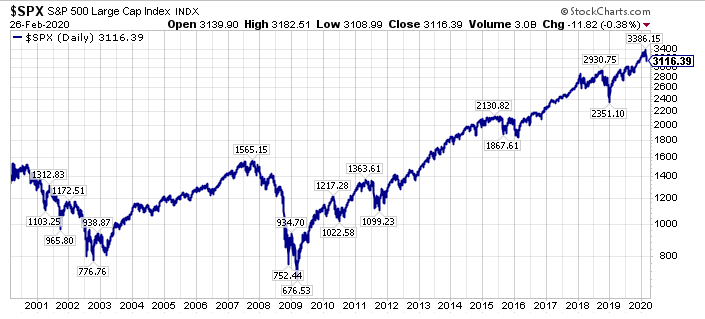
Even though the S&P 500 Index is on track to be down 7% or more this week, as I write this post, the real panic is not in the broader stock market, at least not yet.
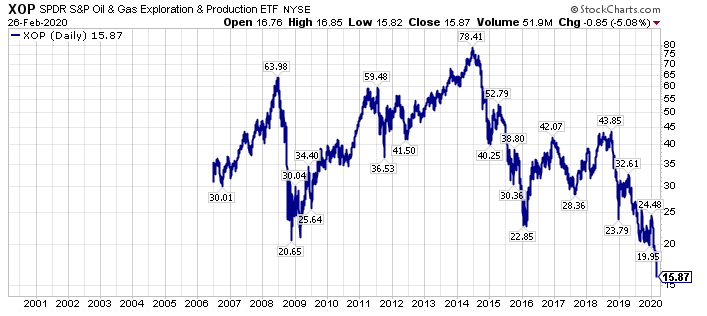
In fact, on a long-term chart, the recent decline is just a blip.
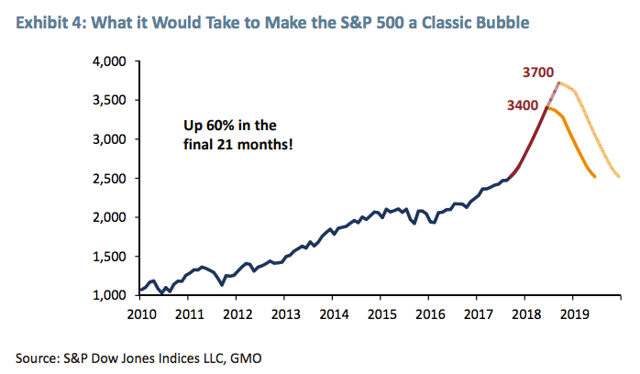
Now, we could be on our way to a broader stock market sell-off, as GMO has previously outlined earlier in 2018.
Regarding the path of the broader markets, that is yet to be determined, as we grapple with historically extended valuations, and historical monetary policy accommodation levels.
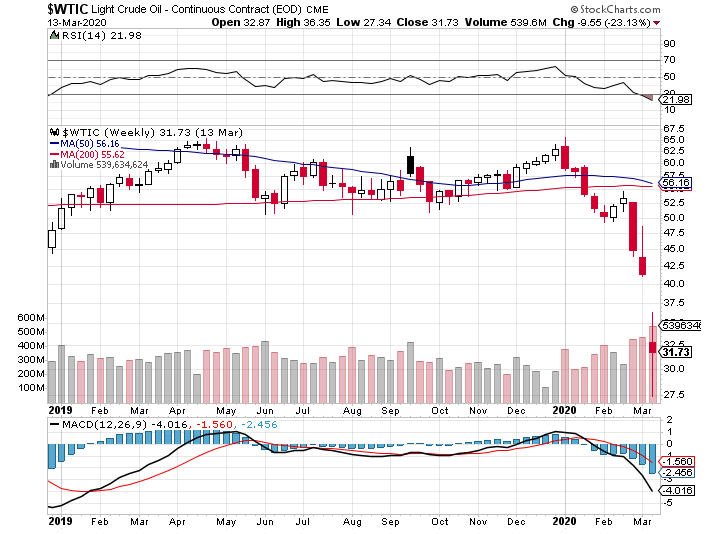
The real panic right now is in the underbelly of global economic activity, specifically in economically sensitive cyclical stocks, and more specifically, in the most loathed of all stock market sectors today, which is of course, the energy sector.
The SPDR S&P Oil & Gas Exploration & Production ETF (XOP) offers a glimpse of this panic, with XOP down 79.8% from its 2014 high, and down 63.8% from its 2018 high.
Thus, with the broader U.S. stock market, as measured by SPY, only down roughly 8% from its recent highs, the compare & contrast should be eye opening for most investors.
Building on the narrative, with our deep research dives, we feel there are a number of out-of-favor equities that are down even greater in percentage terms, which offer even greater relative and absolute opportunity.
Importantly, similar to several of the downtrodden equities I purchased in late 2008, and early 2009, including General Growth Properties, and Genworth Financial (GNW), which was also bought well below $1 in November of 2008 before shares rebounded above $18 by early 2010, the most out-of-favor, undervalued equities right now, will probably bottom ahead of the bottom in the broader equity market.
Panic Selling Is Yielding Opportunity
It is no secret that I am targeting what I believe are the most undervalued securities, with the goal of creating a generational wealth opportunity. These securities are generally loathed, unloved, and scorned right now, and many of these equities would make your stomach turn looking at long-term charts, part of the reason there is so much opportunity.
While the best opportunities are generally in smaller capitalization names, there is opportunity in large-caps, including in energy stalwarts like Exxon Mobil (XOM), Occidental Petroleum (OXY), and Schlumberger (SLB), all of which offer attractive yield-oriented income opportunity.
These three securities are part of a “Stuck On Yield” Model Portfolio, which is a $100,000 portfolio, that I created on Friday, February 21st, for a family member.
This Portfolio is yielding over 14% right now, and I have done deep-dive due diligence on all its member components, a majority of which are from the target rich energy sector.
Members of The Contrarian can see this Model Portfolio here, and I have sent out emails of this Portfolio to members of my research services, and I will be making it available this week for all my research members.
Closing Thoughts – Be Ready To Buy Now
Nobody, including me, really knows where the stock, bond, and commodity markets are headed right now with certainty. All we have is probabilities, and ultimately, our valuation analysis. The latter is crucially important, as buying the most undervalued assets, ultimately leads to the strongest returns, so long as you can ascertain the underlying asset quality, and survivability of the corporate entity.
On this note, I am going to make mistakes, so the key is getting a handful of these right, as the gains from the survivors will more than make up for any losses, at least that is my past experience at previous inflection points. Ultimately, valuation matters, and starting valuations levels matter too. Adding to the narrative, with everyone wanting to own quality today, there are many “Have Not” securities that are historically undervalued.
Conversely, a high valuation is a bad starting point, and buying overvalued assets, which certainly describes the S&P 500 Index, which trades at greater EV/EBITDA, Price/Book, and Price/Sales multiples that it did at its peak valuation levels in late 1999/early 2000, is a recipe to achieve poor returns going forward. Adding salt to the wound, the bond market, which offers meager sovereign yields, is also set-up for poor future returns over the longer-term, as historically over 90% of bond returns are correlated with starting yields.
In summary, buy what is cheap, andbuy into the panic, as the cheapest valuation equities with the best future return prospects will often rebound ahead of a bottom in the broader equity market.
Specific to my research services, I am offering a 20% discount to membership (I am extending this through March) to “The Contrarian” (past members can also direct message me for a special rate), the lowest price point since the founding members price, where we have a live documented history dating back to late 2015..
Additionally, I am offering a limited time 50% discount for the first 5 new members (I expect these slots, some of which I view as a stepping stone to “The Contrarian”, to fill up fast as they have done previously) to a host of research options, including a lower price point. If you subscribe to a premium option (I have had one concierge slot open up after a gentleman I was speaking to last evening held off on taking this slot), I will set-aside time for a personal phone call to get up to speed. To get these offers, go here, and enter coupon code “opportunity” without the quotes.
Reach out with any questions via direct message (I enjoy the dialogue at market inflection points).
Via my research services, or another avenue, please do your due diligence, and take advantage of what I believe is a historic inflection point, which I believe will supersede 2000-2002 in the growth-to-value rotation.
Disclosure: I am/we are long MIC, OXY, SLB, xom and short spy in a long/short portfolio.
Additional disclosure: Every investor’s situation is different. Positions can change at any time without warning. Please do your own due diligence and consult with your financial advisor, if you have one, before making any investment decisions. The author is not acting in an investment adviser capacity. The author’s opinions expressed herein address only select aspects of potential investment in securities of the companies mentioned and cannot be a substitute for comprehensive investment analysis. The author recommends that potential and existing investors conduct thorough investment research of their own, including detailed review of the companies’ SEC filings. Any opinions or estimates constitute the author’s best judgment as of the date of publication, and are subject to change without notice.
This is just a short post to document something remarkable.
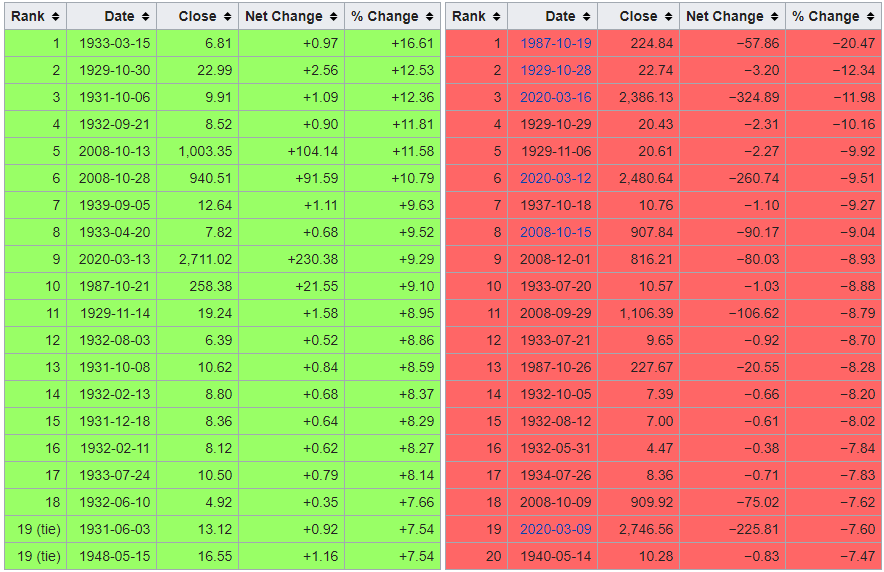
Volatility is actually above 2008’s high levels.
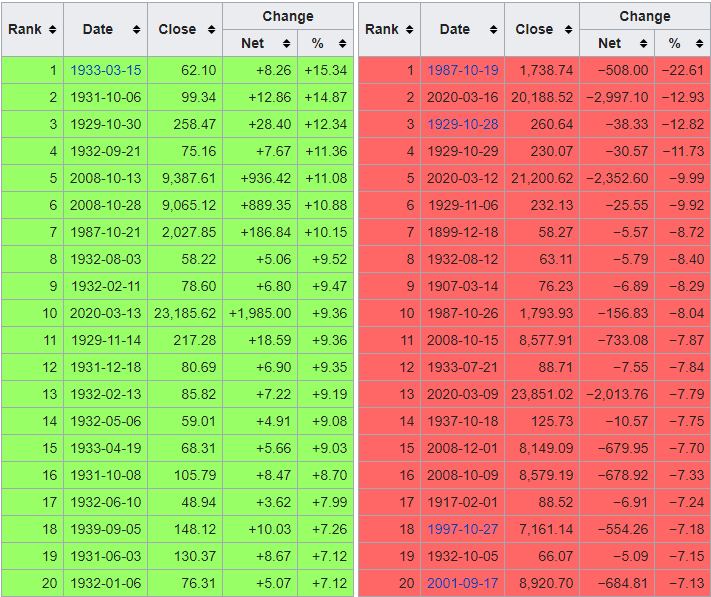
With the Dow Jones Industrial Average (DIA) posting is second worst percentage decline ever, and a cluster of recent days on the worst performing days list, perhaps the jump in volatility amid the COVID-19 pandemic should not be a surpise.
Adding to the narrative, the S&P 500 Index (SPY) posted its third worst percentage decline day ever.
Ultimately, volatility is opportunity, and this elevated volatility will not be around forever. Thus, I think market participants should be making their shopping lists for what to own on the long side.
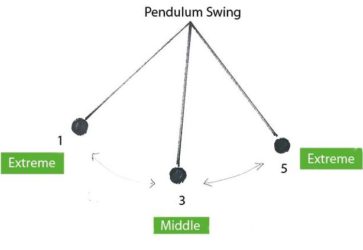
Growth investing has dominated value investing for the past decade.
The pendulum has swung to a rarely reached extreme.
As it swings back the other way, which I believe it has started to do with the price action in October, there should be significant opportunity.
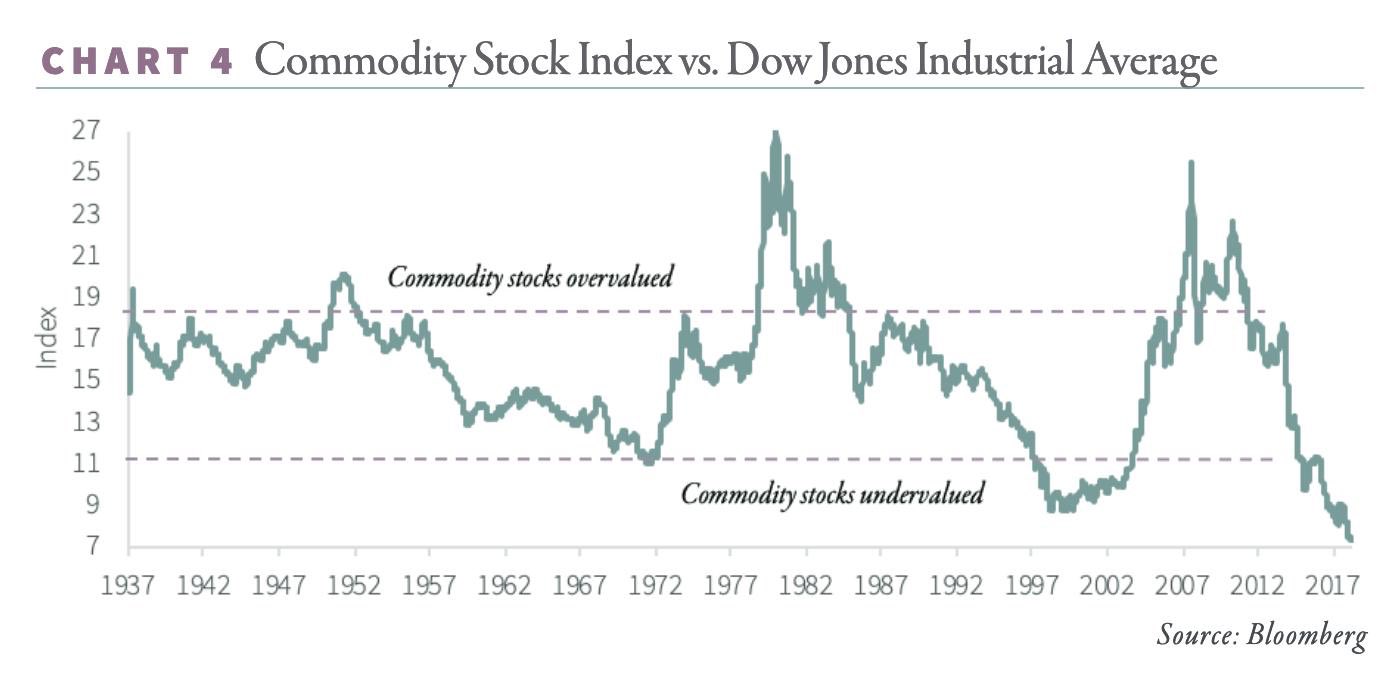
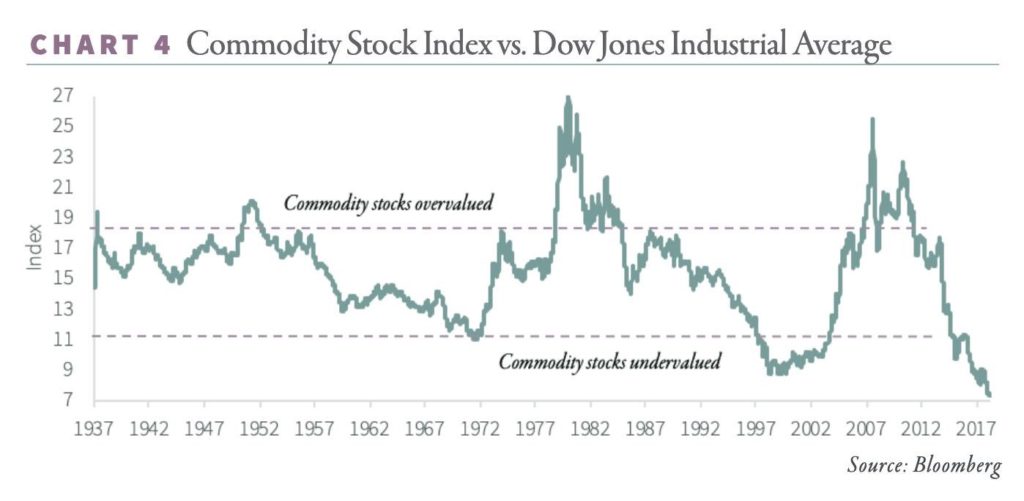
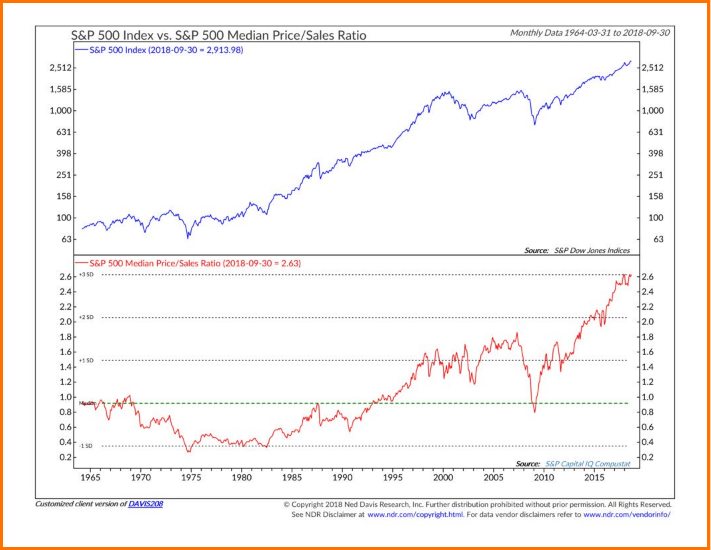
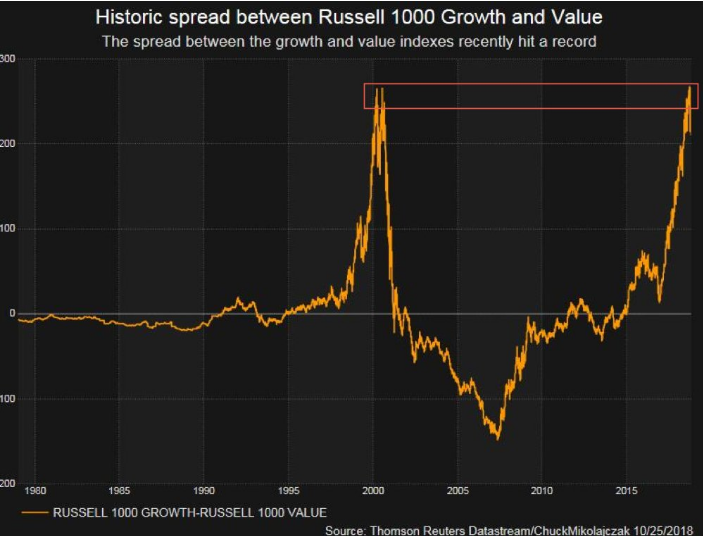
There is an old saying that a picture says a thousand words, so with that in mind, take a look at these two charts, the first from Ned Davis Research, and the second from Chuck Mikolajczak, by way of Alastair Williamson.
Looking at the charts, two conclusions should be abundantly clear.
1. The U.S. equity market has been in a bubble, and this bubble has exceeded the epic 1999/early 2000 peak valuations in certain areas.
2. Growth companies, led by the infamous quintet of Facebook (FB), Amazon (AMZN), Apple (AAPL), Netflix (NFLX), and Alphabet (GOOGL), and carried along by many others, including NVIDIA (NVDA), and more recently, before its even more recent decline, Advanced Micro Devices (AMD), have been in-favor to the extreme excesses of the late 1990’s, while value stocks have rarely been this out-of-favor historically, on a relative basis.
The price action in October was a wake-up call, with AMZN, perhaps the leading flag carrier for the markets broader price action the past decade, down -20.2%, and cast aside, forgotten companies like Southwestern Energy (SWN), which is one of my favorite buy-and-hold investments today for the next decade, up 4.5% for the month, even with the S&P 500 Index (SPY), which is dominated by the large-cap technology growth stocks, down -6.9% for the month.
In an irony of ironies, Southwestern Energy was actually the worst performing S&P 500 Index component from the U.S. equity bull market starting point of March 9th, 2009, through its exclusion from the venerable index in 2017, due to its lower market capitalization, which was caused by its share price decline and severe under-performance.
I would bet almost anything, that Southwestern Energy, which has undergone a very dramatic transformation the past three years that we cover in depth in The Contrarian, outperforms the S&P 500 Index over the next decade.
There are whole studies that cover how unpopular companies outperform, particularly those booted from popular indices like the Dow Jones Industrial Average (DIA), and that is the place to look for opportunity today, in my opinion.
After all, there is a reason that Ibbotson data, now part of Morningstar (MORN), shows small-cap value as the best performing asset class in the market over the long-term.
Sure, this has not been the case for the past decade, but as we showed above, the U.S. equity market has been in a historic bubble, and value equities have been historically out-of-favor.
For a first-look at the forgotten companies that I will be covering in-depth, and have been covering in-depth, please consider joining The Contrarian, which is my premium research service platform on Seeking Alpha.
I am biased, of course, but I think we have the best group of investors and traders anywhere, seasoned by nearly three years of experience together, positive and negative, and commentary for some members, with many members actively contributing their unique perspectives to a robust Live Chat discussion on a daily basis, particularly when volatility surfaces.
Right now, we have an open free trial at The Contrarian, so if you have ever had an interest in test driving our group, now is a good time.
From my perspective, as I said in my blog posts the past two weeks, it would be worth taking a look, simply to view the Live Chat dialogue.
I do recognize that the price point of The Contrarian is a little steep, coming in as one of the more expensive services in SA’s Marketplace.
Over the years, I have had quite a few requests for a lower-priced, more streamlined research product, and over the last several months, I have slowly put together a more traditional research newsletter.
To celebrate this official soft launch, which includes a deep-dive research report on what I believe is an extremely timely equity (delivered via email upon membership), I am offering a limited time $299 annual membershipfor the first 100 members. To get this discounted price, simply use the coupon code “first100”. (WTK’s Note: There are a few slots left remaining at this introductory price).
Ultimately, I think we are now at a major inflection point in the financial markets, highlighted by the price action in October of 2018, which has been ongoing in slow motion for three years, but which could suddenly accelerate. Being different, being contrarian, has been extremely painful for a long time now, however, resilience and persistence, two necessary qualities for success in contrarian investing, in my opinion, are leading to what I believe is an upcoming golden age for active investors.
If you have any questions, send me a direct message at any time,
William “Travis” Koldus
Disclosure: I am/we are long SWN and short SPY as a market hedge.
Additional disclosure: Every investor’s situation is different. Positions can change at any time without warning. Please do your own due diligence and consult with your financial advisor, if you have one, before making any investment decisions. The author is not acting in an investment adviser capacity. The author’s opinions expressed herein address only select aspects of potential investment in securities of the companies mentioned and cannot be a substitute for comprehensive investment analysis. The author recommends that potential and existing investors conduct thorough investment research of their own, including detailed review of the companies’ SEC filings. Any opinions or estimates constitute the author’s best judgment as of the date of publication, and are subject to change without notice.


 (Source: Author’s May 2016 Article, Seeking Alpha, Morningstar)
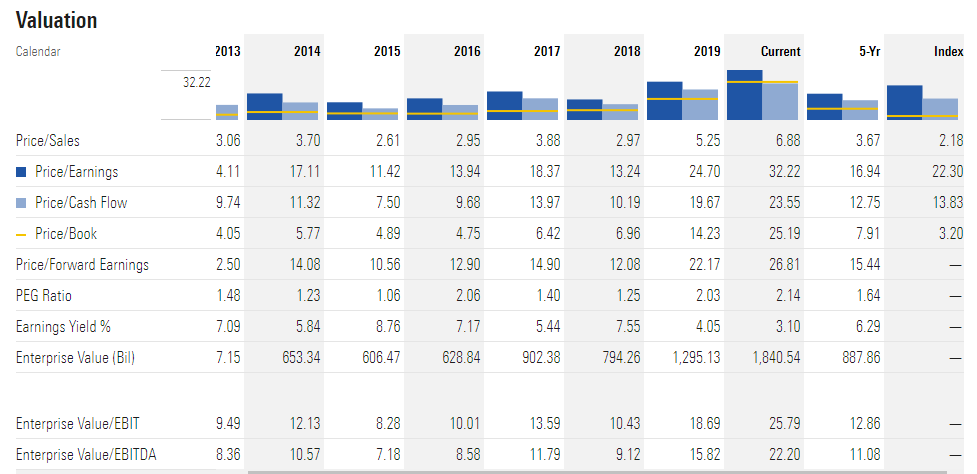


