Brief Intro Note From Travis
While the Fed has 5-6 more interest rate hikes projected to get back to the projected neutral Fed Funds Rate according to the Fed’s Dot Plot, which is at the low end of historical neutral rates, the financial market is going to force the Fed to pause in their rate hiking campaign.
How?
The Fed is not going to invert the yield curve, and the market is going to force the Fed’s hand, providing a tailwind for an unexpected market development, which is the return of sustained inflationary pressures.
Thesis
The Fed will not invert the yield curve intentionally, and this reluctance will cause the Fed to settle at a lower Fed Funds Rate, at least temporarily, providing a continuation of historically accommodative monetary policy.
Setting The Stage – The Market Is Going To Force The Fed’s Hand
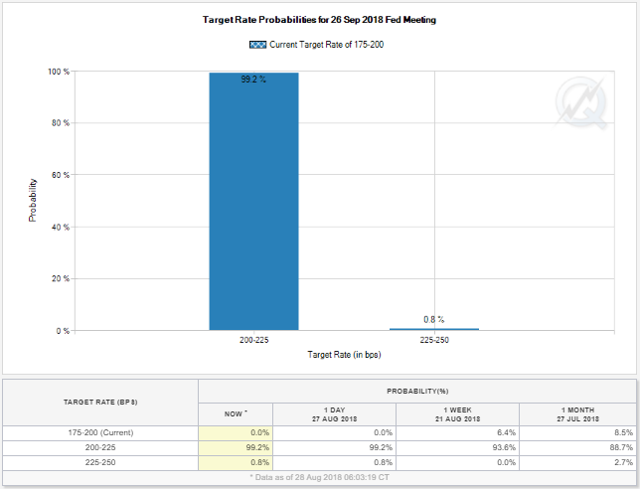
Right now, the market is pricing in a 99% chance of the Fed raising the Fed Funds Rate from a range of 1.75%-2.0% to 2%-2.25% at their September 2018 meeting.
 Additionally, the financial markets are pricing in a 67% chance that the Fed will raise the Fed Funds Rate an additional quarter point at their December 2018 meeting to a range of 2.25%-2.50%.
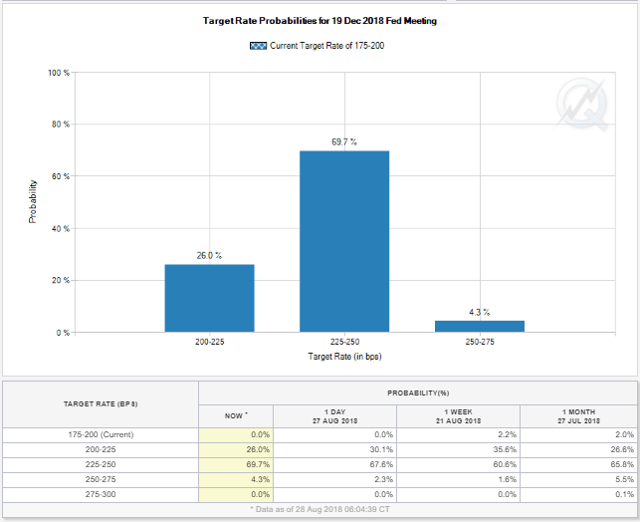 So far, so good, according to market expectations.
However, looking out a year from now to September of 2019, there is only a 37% chance, according to the financial markets, that the Fed will raise rates one more time to the 2.50%-2.75% Fed Funds Rate target range.
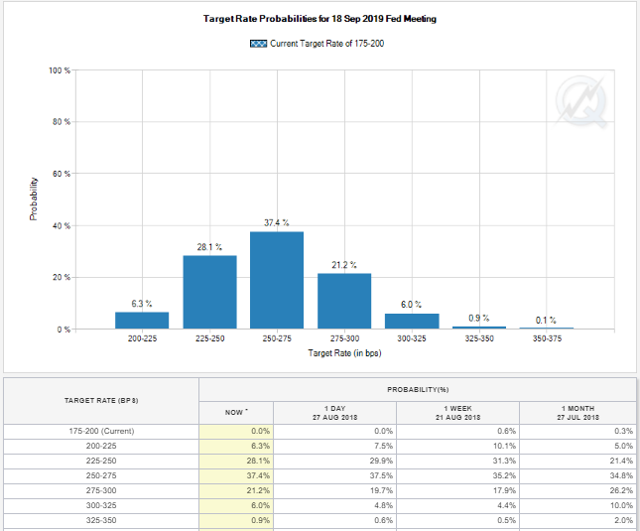 Additionally, looking at the table above, there is a higher percentage chance, according to the financial markets, that the Fed will not raise rates one single time from December of 2018 all the way through September of 2019, versus the Fed raising rates twice.
Building on the narrative even further, the financial markets are pricing in a higher probability of a cut in the Fed Funds Rate in 2019, after the December 2018 Fed Funds Rate increase, than three Fed Funds rate hikes in 2019.
Market Expectations Do Not Square With The Dot Plot
While the financial markets are current predicting three more rate hikes in total through September of 2019, the Fed’s most recent Dot Plot showed four rate hikes in 2018 (two more to go) and an additional three rate hikes in 2019.
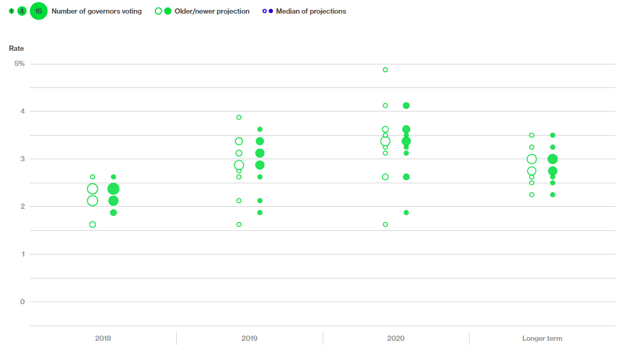 Clearly the market is much more pessimistic than the Fed’s own projections for their path of interest rates.
Why is this the case?
Yield Curve On The Cusp Of Inverting
The answer as to why the market’s expectations of future interest rates is more pessimistic than the Fed’s can be found in the yield curve.
Specifically, in the United States, 2-Year Treasury Yields have kept on rising, and remain near their recent highs.
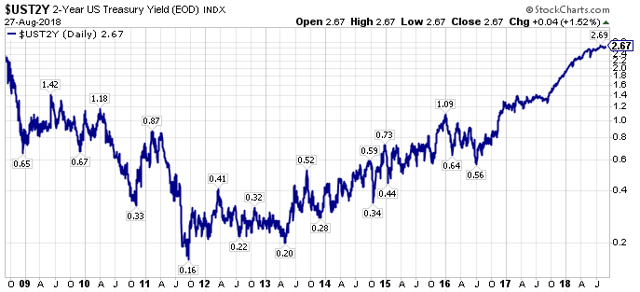 However, 10-Year U.S. Treasury Yields have retreated from their recent highs, as the fears of higher long-term interest rates that were prevalent near the beginning of 2018, have receded.
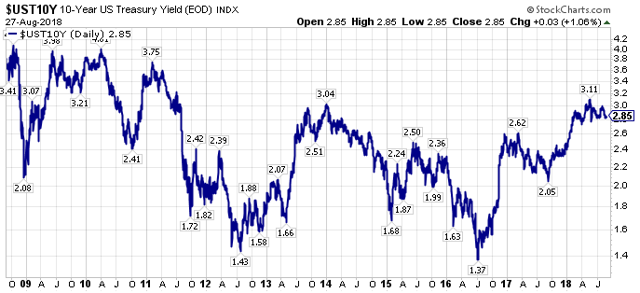 With 2-Year Treasury Yields continuing to rise, and 10-Year Treasury Yields retreating, the yield curve has flattened significantly.
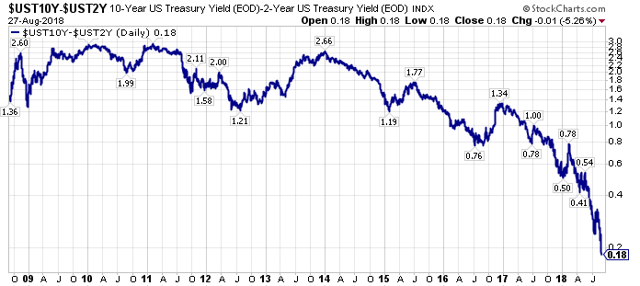 Putting it all together, market participants almost all know that an inverted yield curve has been a marker for a future recession, with a lead time of roughly 18 months.
Thus, we are in an investment landscape where most investors and speculators are casting a wary eye to the future, believing a recession is around the corner.
The Wrong Signal
The yield curve is flattening, and most investors and speculators are trying to make sense of this development.
This price action has obscured something remarkable.
Specifically, under a rules based approach, the Fed Funds Rate should be much higher.
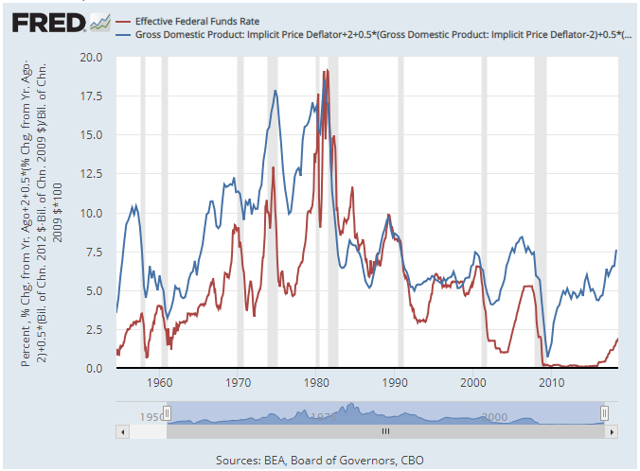 More specifically, under the Taylor Rule, which is shown in the blue line in the above graph versus the actual Fed Funds Rate in depicted by the red line, the Fed Funds Rate under a rules based approach is targeted at 7.5%.
Before dismissing this analysis reflexively because of the level of the forecast, look how closely the Taylor Rule implied Fed Funds Rate tracked the actual Fed Funds Rate from 1980-2000.
Why is the Taylor Rule suggesting such a high Fed Funds Rate?
Two answers come to mind.
First, even though the current economic recovery dating to June of 2009 (for reference the U.S. stock market actually bottomed in March of 2009) has been anemic, averaging 2.2% Real GDP Growth, which is the second-worst growth rate for an economic expansion in the post-WWII era, the extraordinary length of the expansion has provided a cumulative economic growth that is greater than most market pundits, including myself, give the market credit for, and this cumulative growth has started to register on capacity restrained barometers.
Second, economic growth has picked up noticeably with the initial readings for Q2 2018 U.S. Real GDP Growth posting a 4.1% growth rate, noticeably above the Real GDP Growth Rate in this expansion.
Adding to the narrative, Real GDP Growth is picking up further, with the Atlanta Fed GDP Now Model back up a 4.6% Q3 2018 Real GDP Growth rate reading.
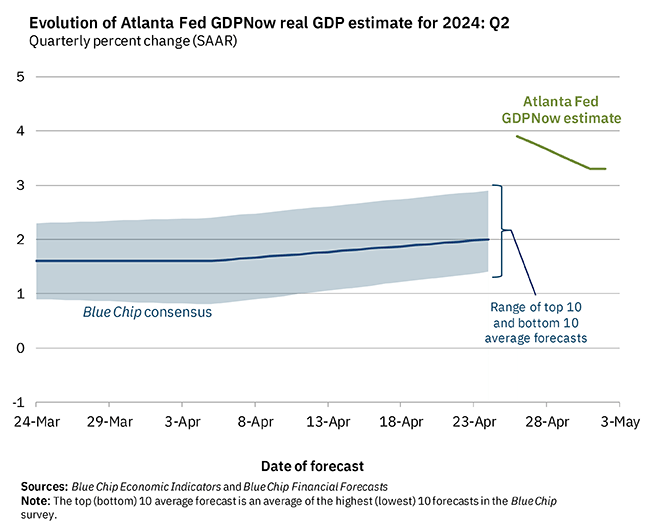
For all its criticisms, the Atlanta Fed GDP Now Model has been more accurate than the Blue Chip economists consensus forecast over the past six months, as the Atlanta Fed GDP Now Model, does not have the biases that human forecasters do, including myself, so if there as truly been a change in the growth paradigm, an unbiased model is likely to capture this change earlier.
Takeaway – Market Is Mispriced
The bond market, stock market, and commodities market are priced for pessimistic growth right now.
The Fed Funds Rate futures market does not even believe the Fed’s own forecasts right now about future interest rates or economic growth.
Historically, where the Fed has been more wrong than right with their forecasts, particularly at inflection points, we can understand the market’s hesitation.
Wait, but isn’t the U.S. stock market at record levels?
Yes.
However, the U.S. stock market has become a “safety trade” for global capital flows over the past decade.
Thus, stock markets outside the U.S. are painting a different picture of performance.
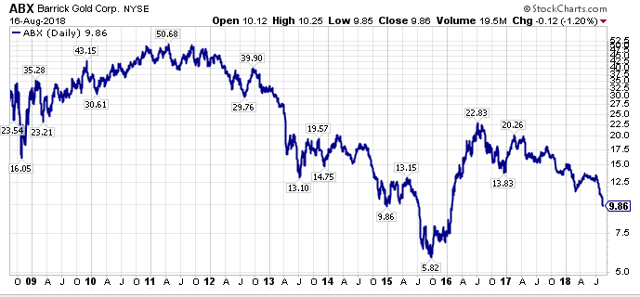
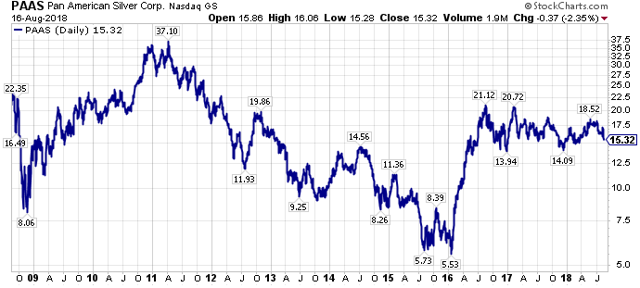
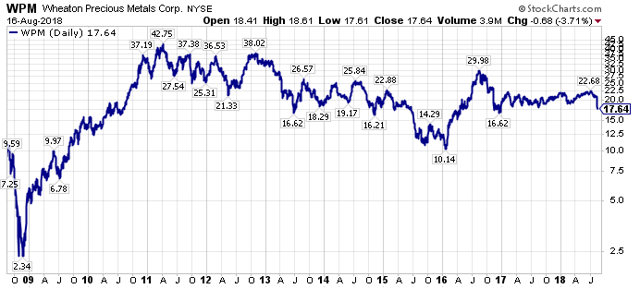
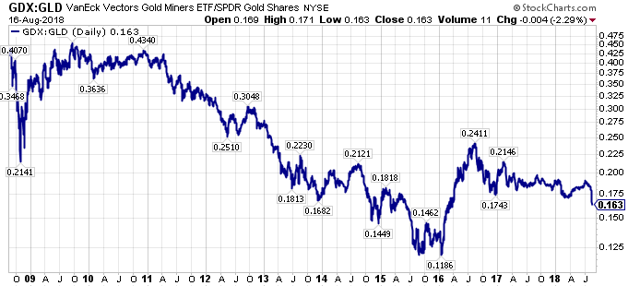
Additionally, below the surface of the U.S. stock market, economically sensitive equities, including many of our favorite targeted equities right now, have had abysmal relative, and absolute, performance over the past decade.
Why?
Economic growth has been disappointing in the United States, relative to past economic expansions over the past decade, and economic growth globally has been disappointing relative to expectations.
However, what if economic growth has finally reached a cumulative level of expansion after roughly a decade of GDP growth, that we are on the verge of triggering a traditional late-stage capital rotation?
Summarizing, for someone who nailed the potentially secular turning points in bonds and commodities in 2016, and who was rewarded for it handsomely, the last twenty months have been more difficult that almost any investing environment I have been through over the past 25 years, as there simply has not been uptake, or follow-through with regard to economically sensitive equities, particularly those value-oriented equities that should benefit the most from a turning point in economic growth expectations
The upside today is trades are more crowded than even 2016, as almost everyone believes in a uniform outcome in the financial markets, yet what if we are finally at the destination, after a very long journey, that demand is outstripping supply on a sustainable basis, and what if economic growth is actually accelerating, not rolling over?
Is the possibility of this scenario even priced in by the markets?
Even if the more modest projections of the Fed are more accurate than the markets current projections, what asset classes would benefit?
The more I think about it, the stage is set for the shunned equities of the past decade, notably commodity equities, international equities, and emerging market equities, to excel going forward.
The curve-ball of July and August of 2018, when liquidity conditions were supposed to permit a rally in risk assets, yet the safe-haven assets outperformed even further, was one of the market’s financial acts of deception, from my vantage point, eschewing investors from the very trades that are set to thrive.
To close, ironically the market is setting up a scenario where the market constrains the Fed, causing the Fed, at a minimum, to pause in their interest rate hikes, and more likely causing the Fed to settle at a terminal Fed Funds Rate in this this rate hiking cycle that is much easier, in-terms of monetary policy accommodation, that past Fed Funds neutral rates.
With the market potentially constraining the Fed, forcing an easier than normal monetary policy, the odds of higher economic growth actually increase, which would further benefit the downtrodden economically sensitive equities and inflation sensitive equities, both of which have been cast aside.
Interested to see if we can get a good discussion going on this,
Travis

