So far, the bond market has diverged from the stock market, and the commodity market. Most think the bond market is the “smart money”, however, Adam Robinson has proven that this has generally not been the case since 2000, as I shared with my members earlier this week.
What does this mean in practicality?
In simple terms, Treasury Yields could be finally poised to rise materially, particularly at the longer-end of the curve.
What could be the catalyst?
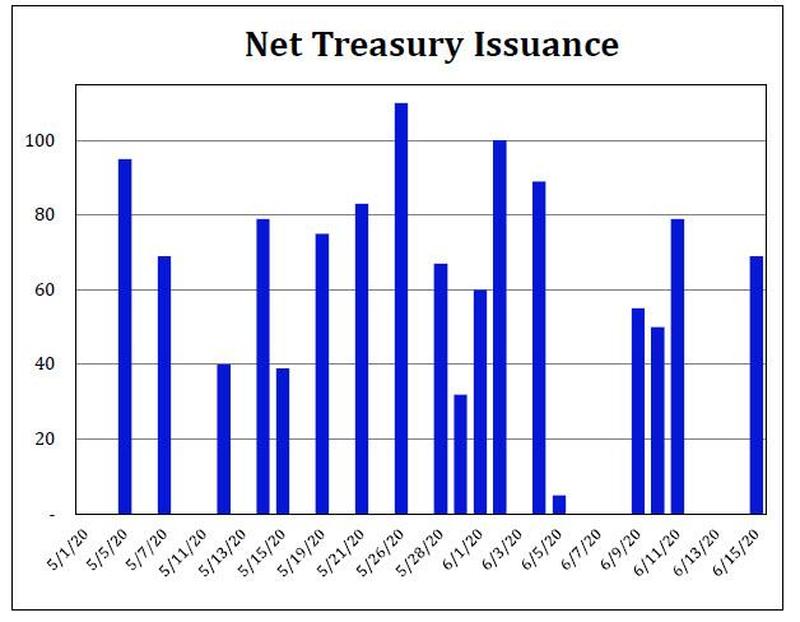
How about new Treasury issuance that outpaces the reduced scope of Fed Treasury buying? This is more probable than it seems, in my opinion, as Fed Treasury buying has gone from a full gusher, at $75 billion per day, to a relative trickle, ending last week with the Fed buying $6 billion in Friday’s trading session.
As coronavirus fears spread, potentially triggering the signal event that ends the seemingly never ending, passive fueled price insensitive and valuation insensitive buying binge, how low can U.S. long-term interest rates go?
U.S. longer-term interest rates seem to already be pricing in a worst case, low growth, low inflation environment forever scenario.
Said another way, maybe the market is not prepared for a different investment landscape developing.
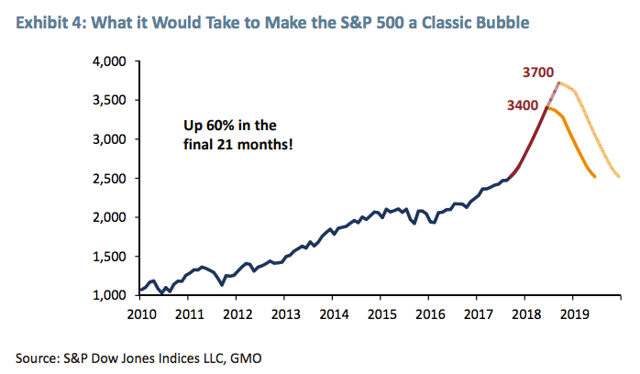
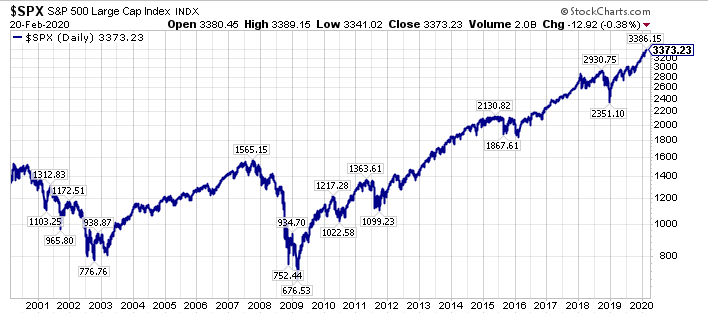
We have clearly followed the path of the classic bubble that GMO laid out in 2008 for the S&P 500 Index ($SPX), (SPY), which is shown below.
The timeline has been slightly different, I call it an extended classic bubble, the slower ride to the final destination. Regardless of the course, we are here now.
The key question is where do we go from here, and the answer, from my perspective, is all a function of interest rates, particularly longer-term sovereign interest rates. With the yield curve close to inverting again, and two Fed Funds rates cuts priced in right now as of this writing (February 21st, 2020) through the December 2020 FOMC meeting, a lot of pessimism is priced in.
Additionally, sovereign interest rates are so low, the question needs to be asked, “How much could they go down in the next recession?”
Last, but not least, what if a recession is averted, or we experience a mild recession, similar to what happened in the midst of the 2000-2002 bear market. On this note, the current investment landscape reminds me an awful lot of late 1999/early 2000, with the moonshot blow-off in Tesla ($TSLA), and the greater concentration in the top-five S&P 500 names ($SPY), which are Apple ($AAPL), Microsoft ($MSFT), Alphabet ($GOOGL), ($GOOG), Amazon ($AMZN), and Facebook ($FB) than in late 1999/early 2000.
We all know how that story ended, however, almost all market participants have forgotten that 2000-2002 time frame, hyper-focused on a fear of a reprisal of 2007-2009, which has led us to where we are today.
And where is that, you may ask?
The answer is that we are on the cusp of a historical capital rotation. Stay tuned.
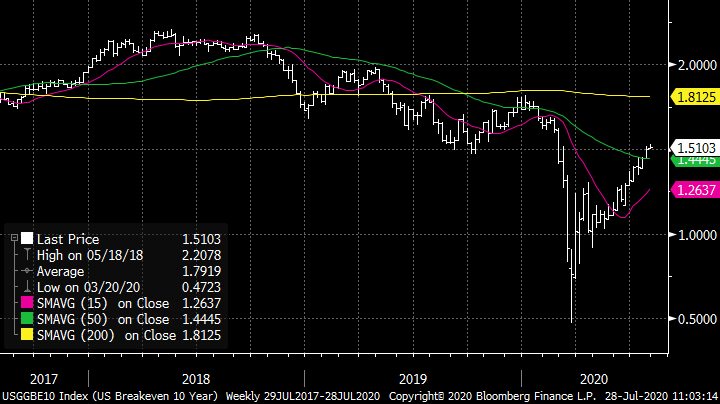
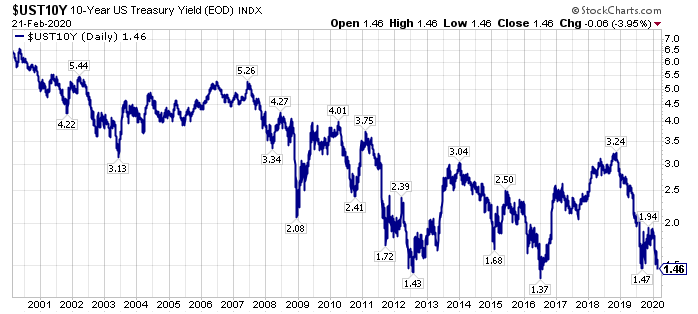
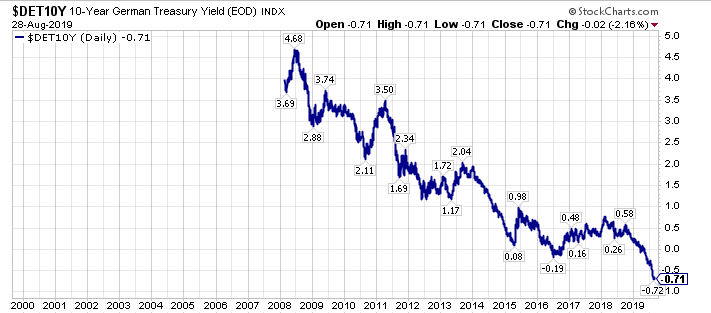
There is a bond bubble of epic proportions today. Nothing illustrates this bubble better than the German bond market, where the 10-Year German Treasury Yield is -0.71% annually.
Look at the above chart again, and think about the consequences. Who would buy a 10-Year Treasury, resigning themselves to an almost 3/4 percent nominal loss annually, which is amplified when measured in real terms?
We will revisit this question later in this post.
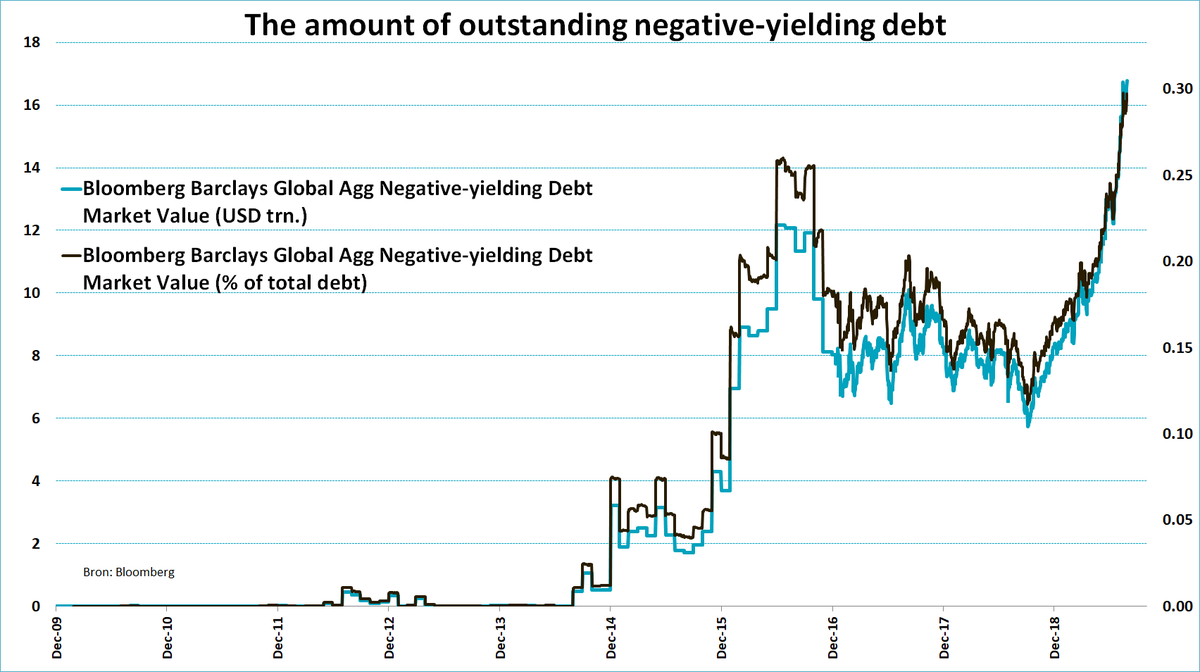
Building on the narrative above, there is over $16 trillion in negative yielding debt today, with negative yielding debt surpassing its previous 2016 high levels, so clearly there are a number of market participants who are currently willing to buy this negative yielding debt. From my perspective, these are mostly traders, who are flipping the bonds to the next buyer (a classic symptom of a bubble), and forced investors who are required to match the duration of their assets to their liabilities (think pension plans).
Looking at past bubbles, the irrationality of price insensitive buyers is prevailing right now in the bond market, however this is a temporary phenomena, something that will dissipate when the bubble dissipates.
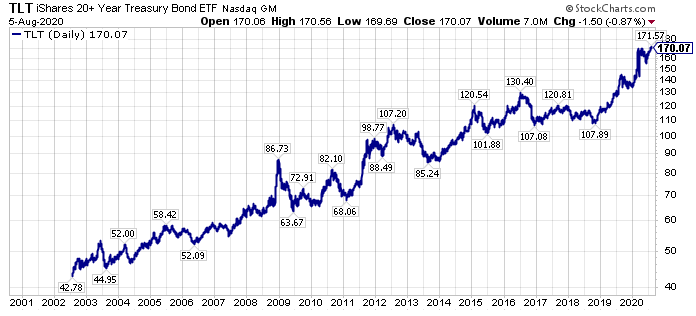
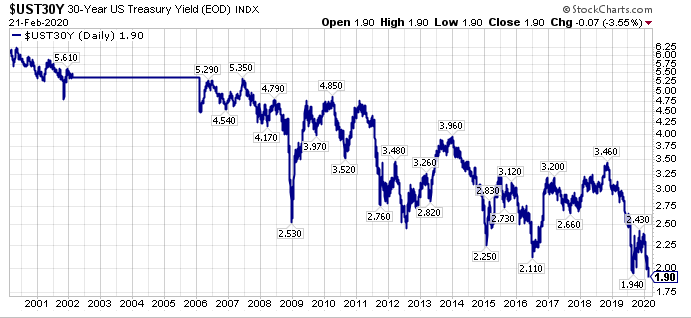
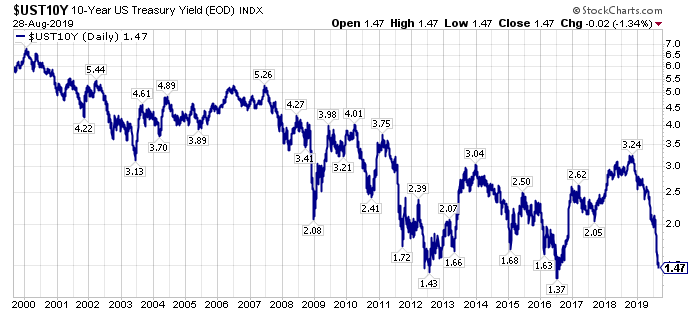
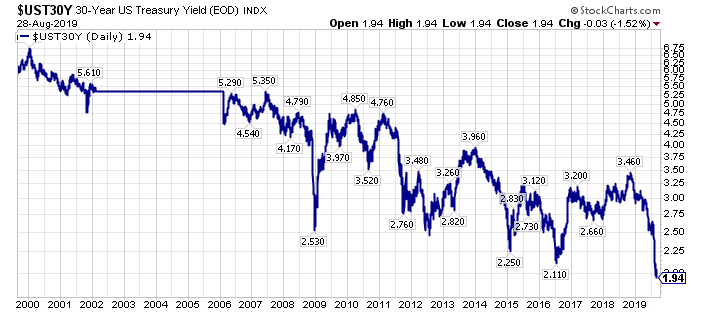
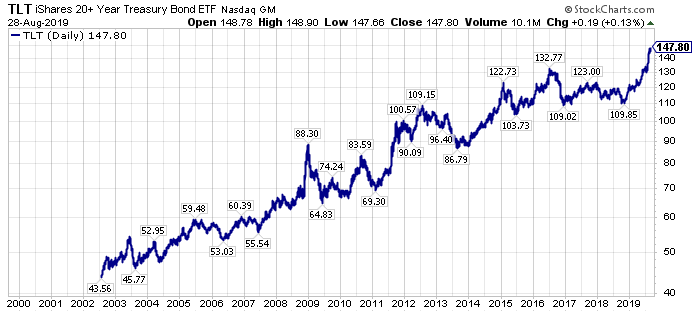
In the U.S., 10-Year Treasury Yields are not below their 2016 lows, at least as of this writing, however, 30-Year Treasury Yields have made new lows.
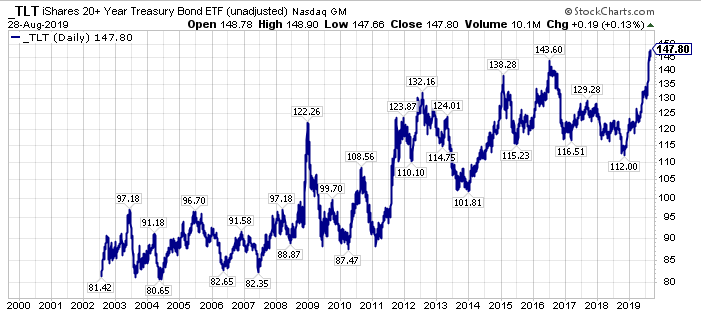
This has caused the iShares 20+ Year Bond ETF (TLT) to make new record highs, both on an adjusted, and un-adjusted basis.
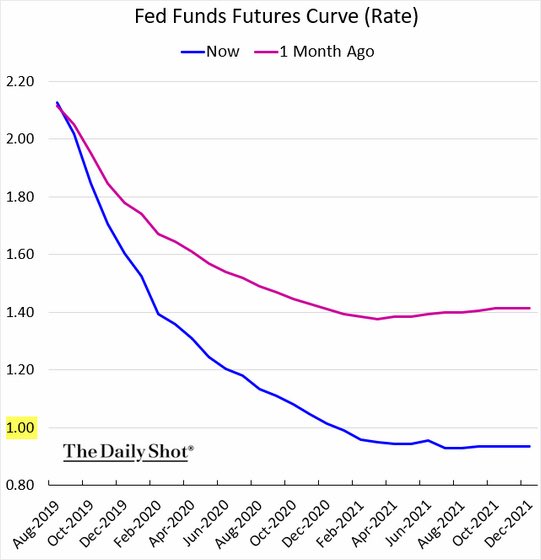
As long-term interest rates cascade lower, and yield curves invert, central banks are ratcheting down their short-term interest rate expectations. On this note, look at the Fed Funds Futures Curve one month ago (in red in the chart below) versus today’s expectations (in blue in the chart below).
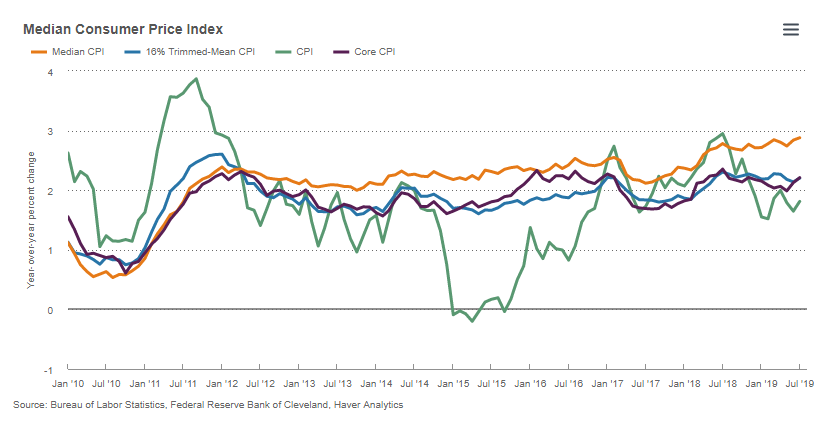
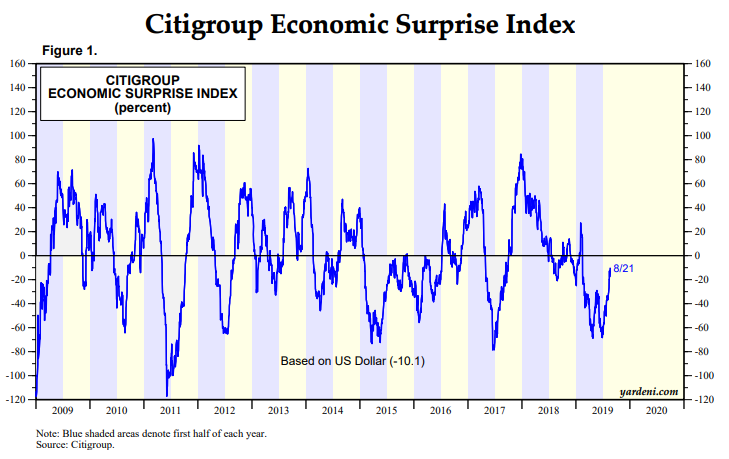
Short-term market projected interest rates are forecasting a steeper path downwards, mirroring the fall in longer-term interest rates, however this is happening as inflation readings, particularly the Median CPI (shown in yellow below), are at the highs of the current economic expansion in the U.S, and as the Citigroup Economic Surprise Index turns higher.
In summary, what happens when the Fed, and central banks ease into a cyclical upturn with bond prices at record highs?
We are about to find out, and if you have ridden this bond bubble, or have ridden some of the investments that have benefited from the bond bubble, specifically REITs (VNQ), (IYR), utilities (XLU), and the perceived higher quality investments, think stocks like Coca-Cola (KO), McDonald’s (MCD), and Procter & Gamble (PG), which have all levitated higher as interest rates have ratcheted lower, you should be thinking about your exit points, in my opinion.
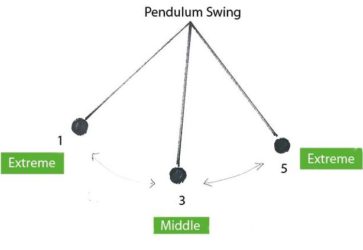
Closing Thoughts – An Epic Bond Bubble With Sentiment At Extremes
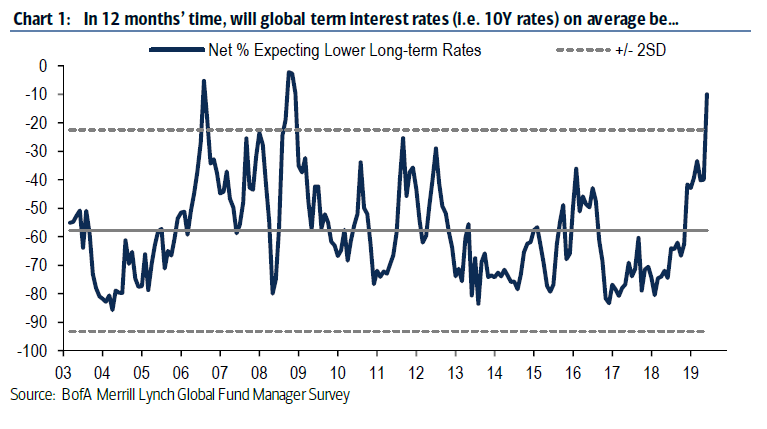
The bond market is at the tail-end of a blow-off bubble, from my vantage point. Sentiment is extremely stretched today, rising to exceed previous highs, which is shown below with this chart from June of this year.
Since June of 2019, daily sentiment readings have risen further, and bond bullishness regularly has exceeded the 2008 /2009 highs.
This bond bubble, is one of a series of bubbles today, which I noted in a recent article as follows:
“Respectfully, there are bubbles everywhere. Specifically in:
Confidence in central banks.
In bonds, with record bond ETF inflows near all-time price highs at the end of an almost 40 year bull market.
In yield-oriented Investments as central banks have pushed investors out the risk curve.
In growth stocks, which are the longest duration assets.
In passive investments, which are price insensitive buyers.”
Wrapping up, and circling back to the earlier question in the article, specifically, “who is buying these negative yielding bonds today”, the answer is primarily speculators, and like past manias, those left holding the “hot potato” are going to get burned.
For a look at a different research approach, I am offering a 20% discount to membership to “The Contrarian” (past members can also direct message me for a special rate), the lowest price point since the founding members price, where we have a live documented history dating back to late 2015, including an updated valuation and price target list for over 103 targeted companies, including several companies that offer upside appreciation potential that rivals the best opportunities of late 2008/early 2009, in my opinion.
Additionally, I am offering a limited time 50% discount for research services on this site. To get this offer, go here, and enter coupon code “august”.
Reach out with any questions.
Via my research services, or another avenue, please do your due diligence, and take advantage of what I believe is a historic inflection point,
WTK
P.S. Resilience, which I have written about, and not getting caught in the herd today (trades are more crowded today than in 1999 or 2007 from my perspective) is paramount for the investment landscape ahead, in my opinion.
Disclosure: I short tlt via put options.
Additional disclosure: Every investor’s situation is different. Positions can change at any time without warning. Please do your own due diligence and consult with your financial advisor, if you have one, before making any investment decisions. The author is not acting in an investment adviser capacity. The author’s opinions expressed herein address only select aspects of potential investment in securities of the companies mentioned and cannot be a substitute for comprehensive investment analysis. The author recommends that potential and existing investors conduct thorough investment research of their own, including detailed review of the companies’ SEC filings. Any opinions or estimates constitute the author’s best judgment as of the date of publication, and are subject to change without notice.
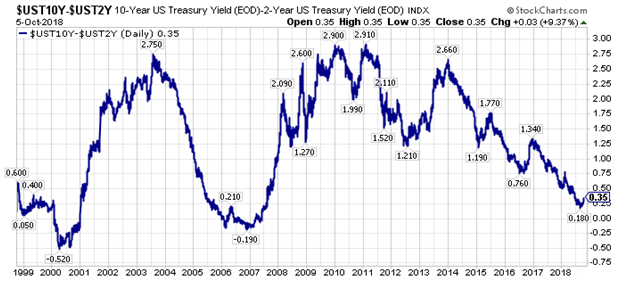
The U.S. Yield Curve has been flattening for a long time, and after a brief rise in 2016, the flattening trend resumed in 2017, and for a majority of 2018.
A recent steepening in they yield curve is already bigger than it was in 2016.
With regard to the broader U.S. equity market, my bearishness has been wrong, thus far (more on this below).
However, specific to the bond market, my public writing has proven fairly accurate, with the iShares 20+Year Treasury ETF (TLT) down -9.1% this year, and down -14.9% since July 1st of 2016 (global sovereign bond yields made their secular lows in the Summer of 2016), as evidenced by the following sampling list of my public SA articles.
Looking at the articles above, the last linked article, the Inflation Is Coming, Are You Prepared article,the The Irrational Fear Of Deflation article, and the Central Bank Bubble Blowing: The Reflation Trade Is Alive article, are all not behind SA’s paywall, so this could be a good starting point for reading.
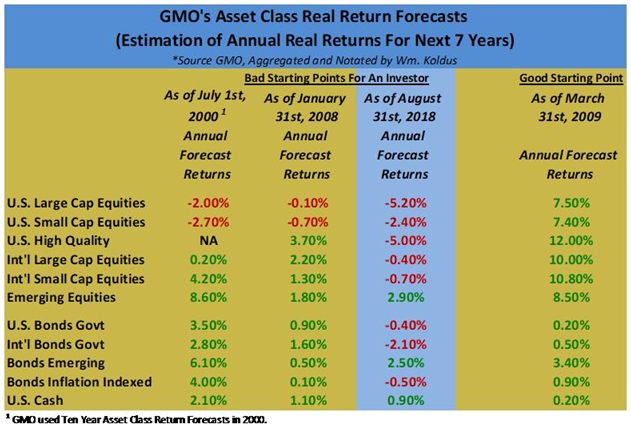
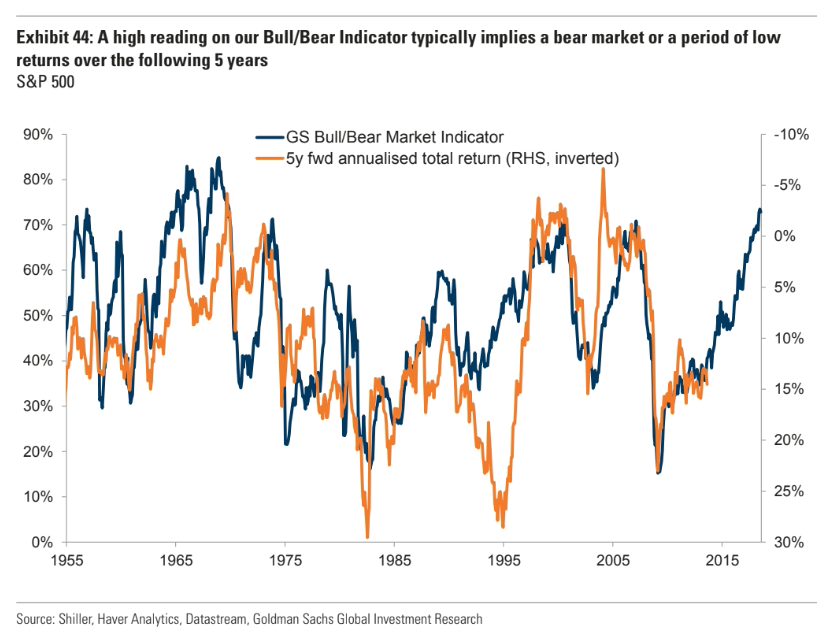
Clearly, I have been bearish on bonds, and U.S. equities too, though so far this has been very wrong with regard to the broader U.S. equity market, though I still think real returns going forward are going to be the worst in modern market history as shown by the table I regularly put together below using data from GMO (first table below), and corroborated by Goldman Sach’s (GS) Bull/Bear Market Indicator (second chart below).
What could cause these poor projected real returns?
One answer is rising interest rates, and ironically higher economic growth, as faster economic growth puts upward pressure on inflation and interest rates, particularly at the longer-end of the yield curve, which has remain stubbornly subdued compared to shorter-term interest rates, as shown by the chart of the spread between the 10-Year U.S. Treasury Yield and the 2-Year U.S. Treasury Yield.
Looking at the chart above, we are clearly early in the steepening of the yield curve. In fact, the upturn only looks like a blip. However, in percentage terms, we have already exceeded the steepening in late 2016, so there may be more to this developing story than meets the eye, especially with the correlated turn higher in longer-term interest rates across the world, including in the United States, Britain, Germany, and Japan.
“Lower for longer” has been a mantra for a long time applied to interest rates, but what if after nearly a decade of a flattening yield curve, longer-term interest rates rise more than almost everyone expects right now?
What would that do to current asset valuations?
Where are the risks in an environment where almost all investors have been chasing yield for over a decade?
Where are the opportunities?
In closing, it is my opinion, that there are many extremely crowded trades, not to dissimilar to past major inflection points in the market that we have collectively witnessed as market participants over the past two decades.
Active investors, particularly value investors, have been punished severely the past decade, however, this pain (and I have endured my fair share or more) is setting up an extraordinary opportunity as price discovery, long cast aside by the indexing/ETF wave, reasserts itself with a vengeance.