Introduction From Travis
It seems like only a short time ago, that there was a broad consensus that July and August would be positive for risk assets.
The opposite has generally been the case, with the exception of what I call the “safety trade”, which is the largest capitalization U.S. equities and indices.
While the last two months have been painful, the sell-off has created opportunities.
Taking A Look At The Summer Sell-Off & YTD Performance
This evening, I picked thirteen equities and ETF’s that span a spectrum of risk assets in the market. They are presented as follows in reverse order of their year-to-date performance.
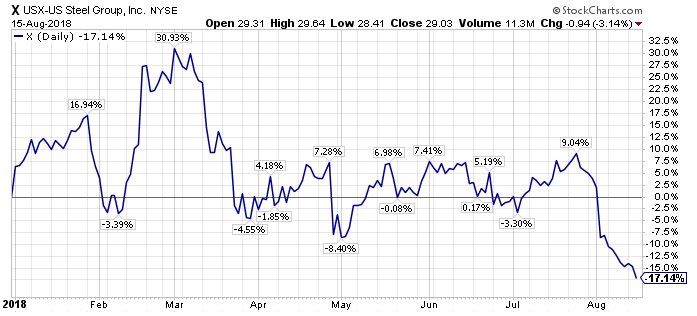
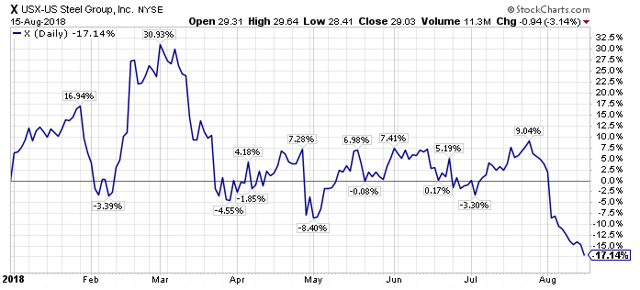
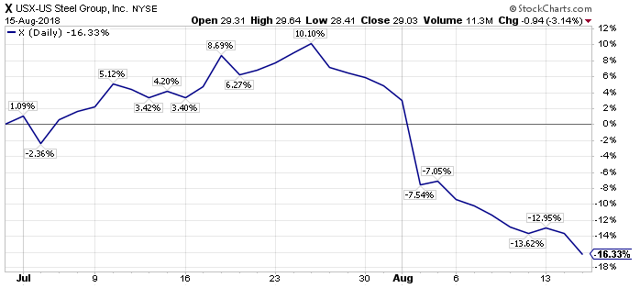
Number 13 – U.S. Steel (X) – Down -17.1% YTD, Down -12.9% from July 1st, 2018, through August 15th, 2018.
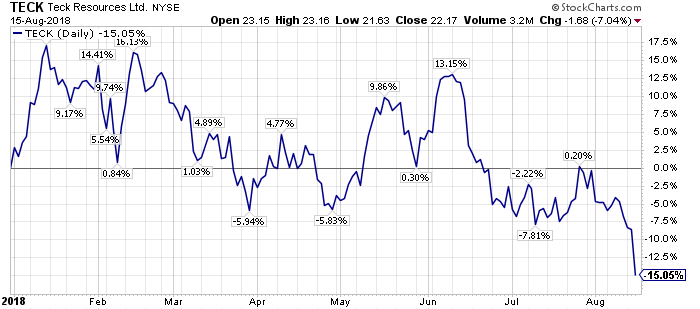
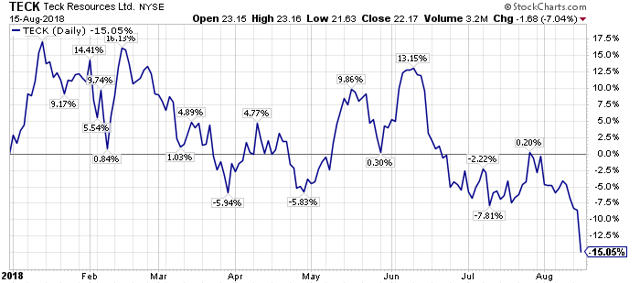
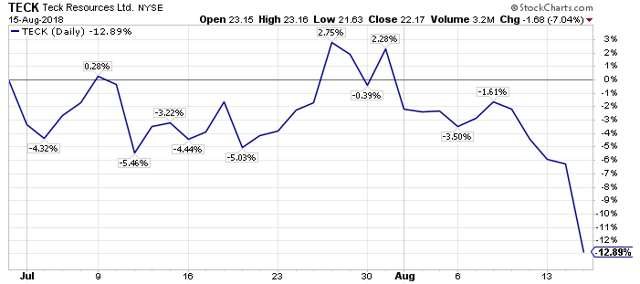
 Number 12 – Teck Resources Limited (TECK) – Down -15.1% YTD, Down -16.3% from July 1st, 2018, through August 15th, 2018.
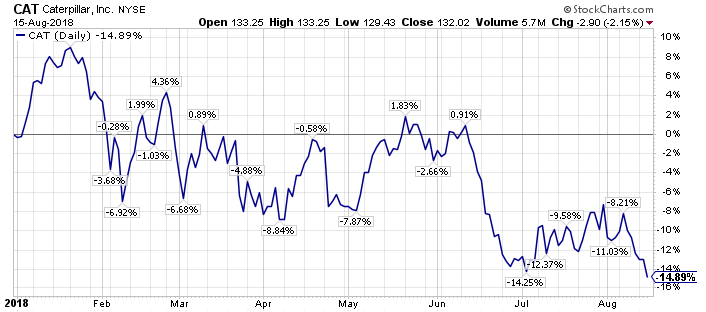
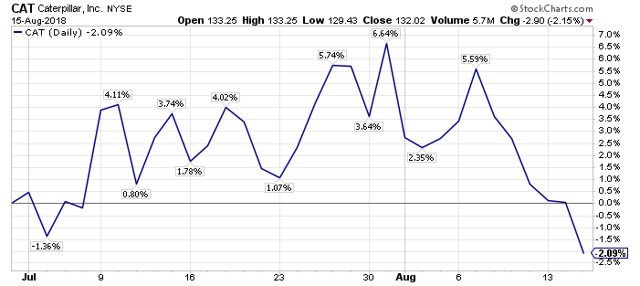
 Number 11 – Caterpillar (CAT) – Down -14.9% YTD, Down -2.1% from July 1st, 2018, through August 15th, 2018.

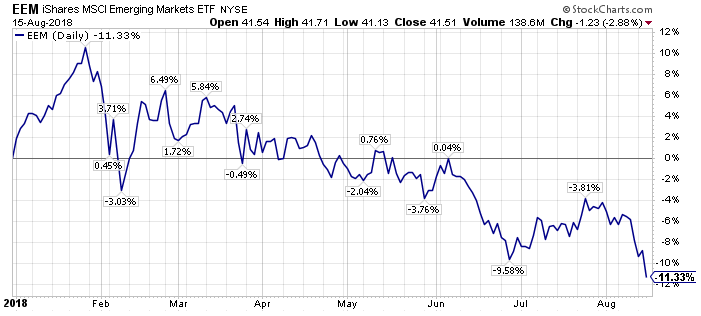
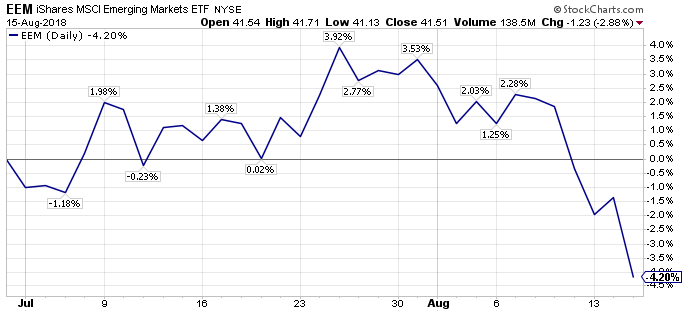
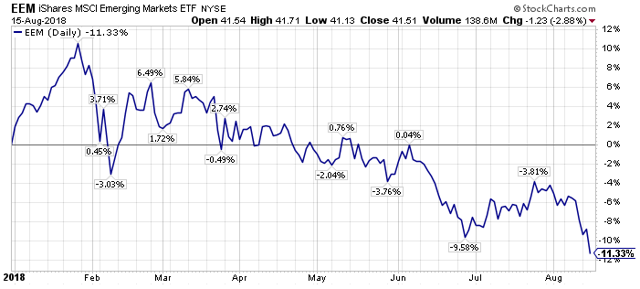
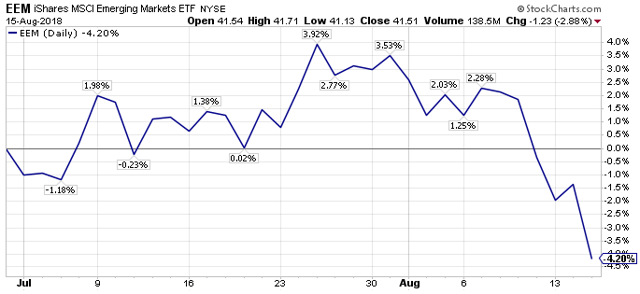
 Number 10 – iShares Emerging Markets (EEM) – Down -11.3% YTD, Down -4.2% from July 1st, 2018, through August 15th, 2018.
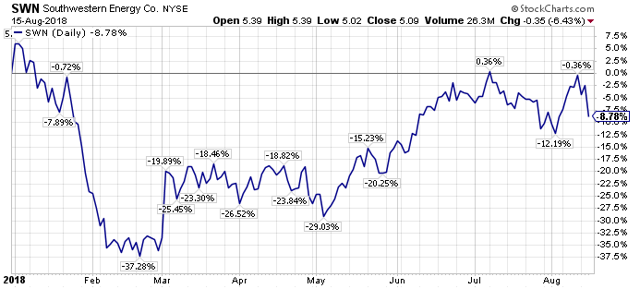
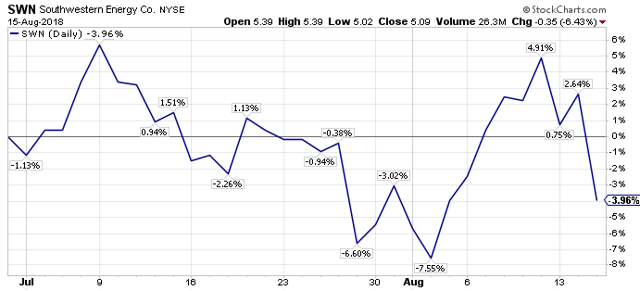
 Number 9 – Southwestern Energy (SWN) – Down -8.8% YTD, Down -4.0% from July 1st, 2018, through August 15th, 2018.
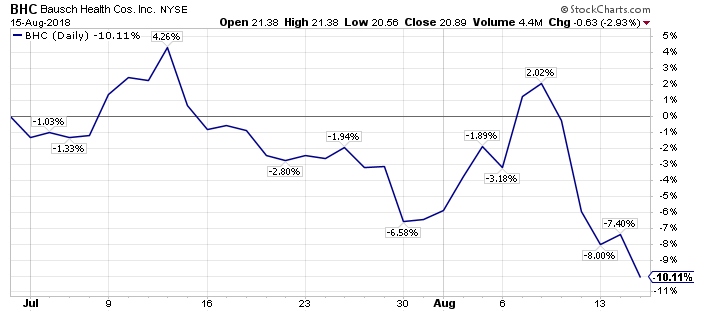
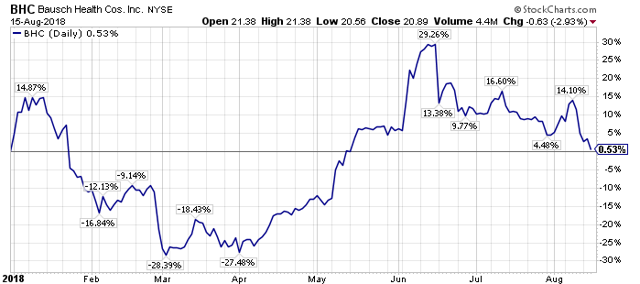
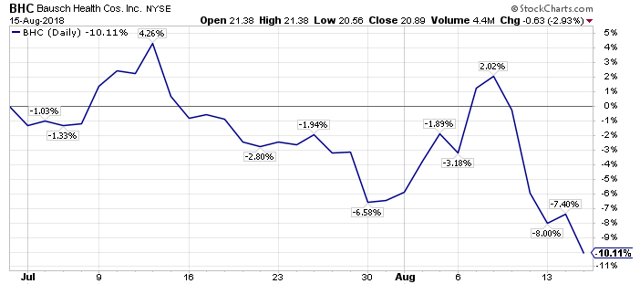
 Number 8 – Bausch Health Companies (BHC) – Up 0.5% YTD, Down -10.1% from July 1st, 2018, through August 15th, 2018.
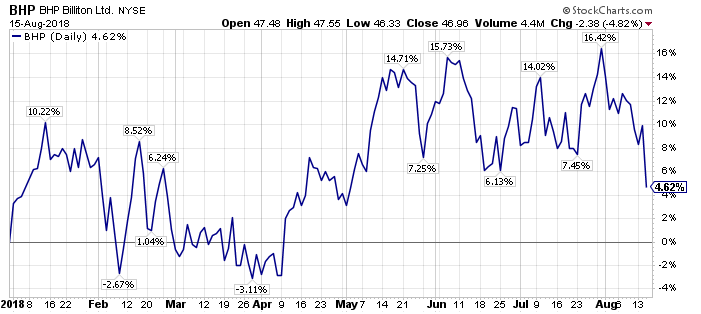
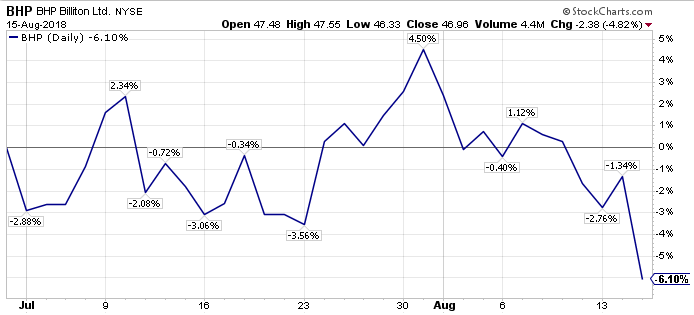
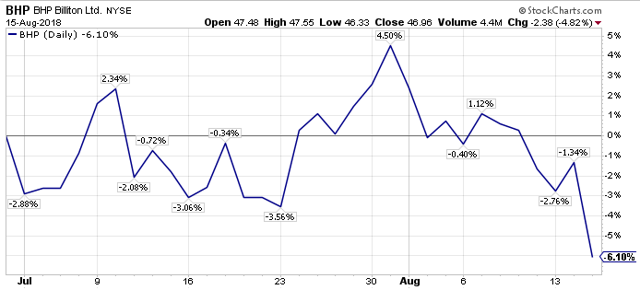
 Number 7 – BHP Billiton (BHP) – Up 4.6% YTD, Down -6.1% from July 1st, 2018, through August 15th, 2018.

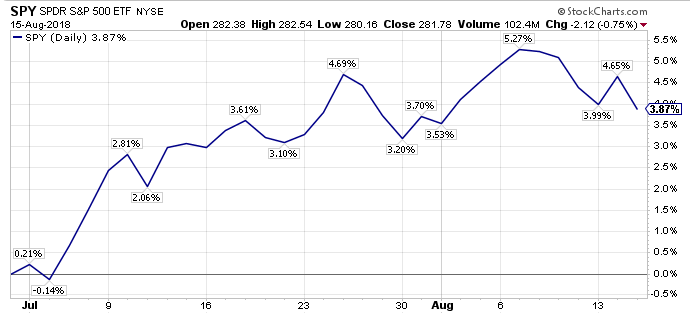
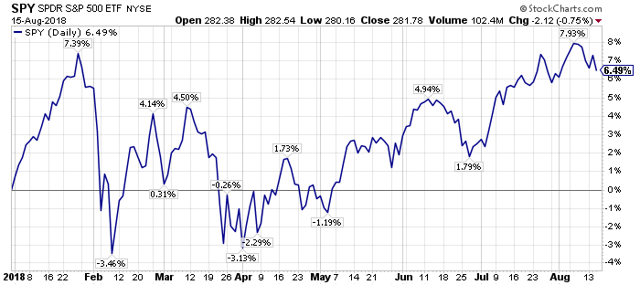
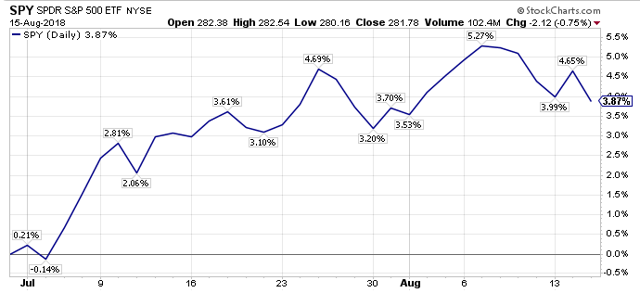
 Number 6 – SPDR S&P 500 ETF (SPY) – Up 6.5% YTD, Up 3.9% from July 1st, 2018, through August 15th, 2018.
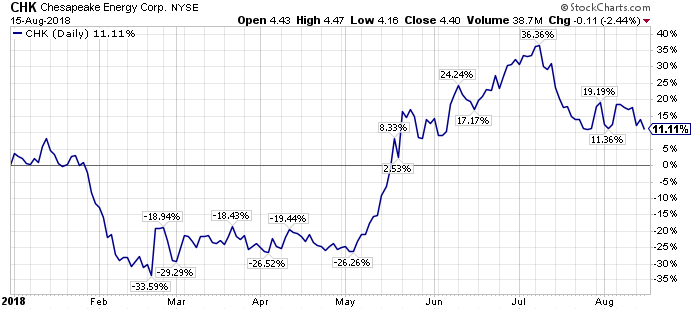
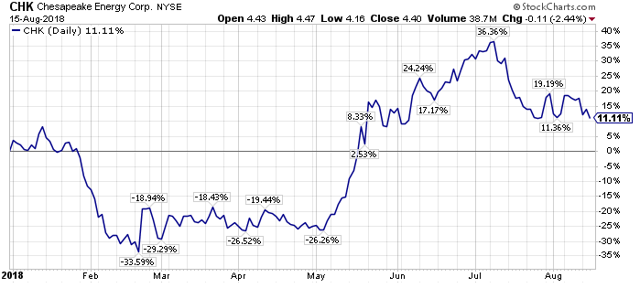
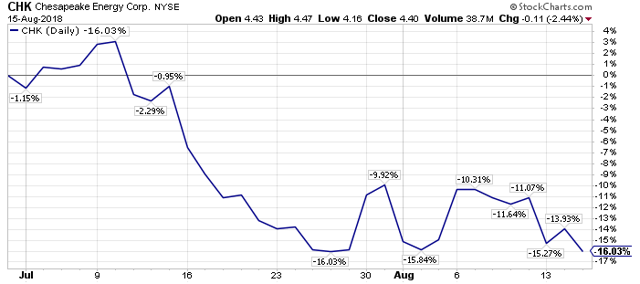
 Number 5 – Chesapeake Energy (CHK) – Up 11.1% YTD, Down -16.0% from July 1st, 2018, through August 15th, 2018.
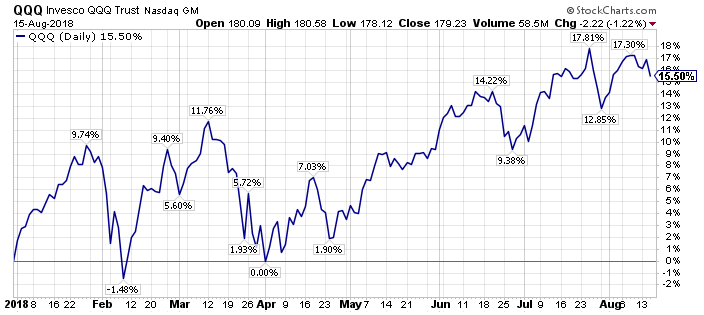
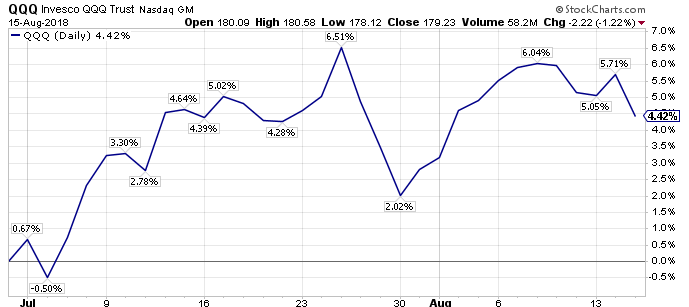
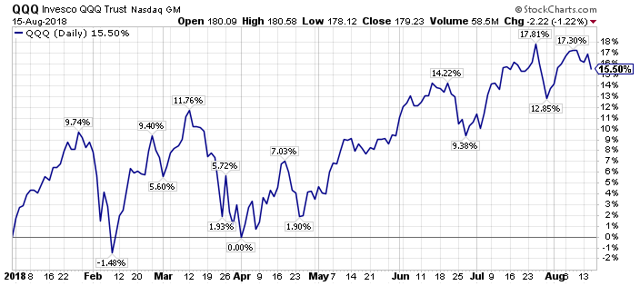
 Number 4 – Invesco QQQ Trust (QQQ) – Up 15.5% YTD, Up 4.4% from July 1st, 2018, through August 15th, 2018.
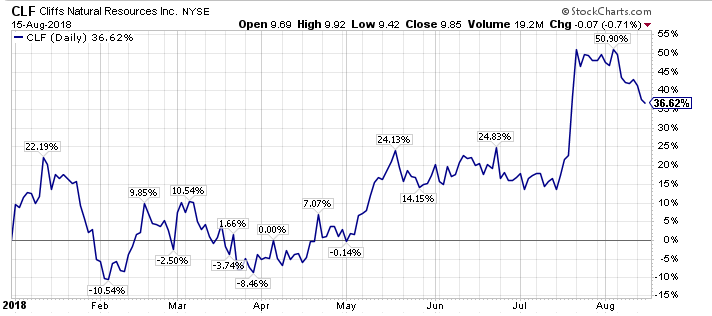
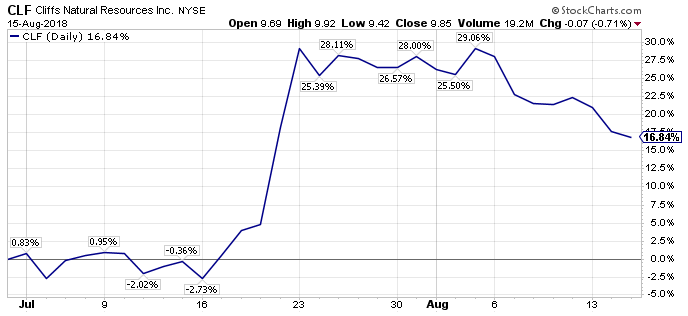
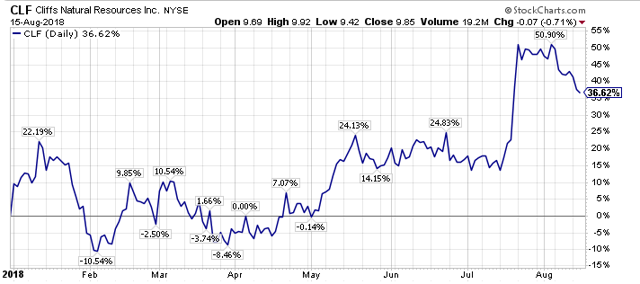
 Number 3 – Cleveland-Cliffs (CLF) – Up 36.6% YTD, Up 16.8% from July 1st, 2018, through August 15th, 2018.
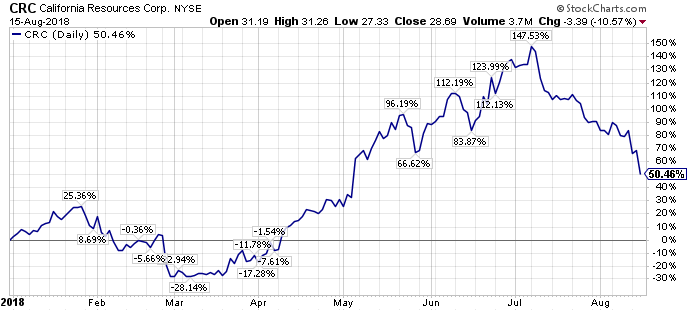
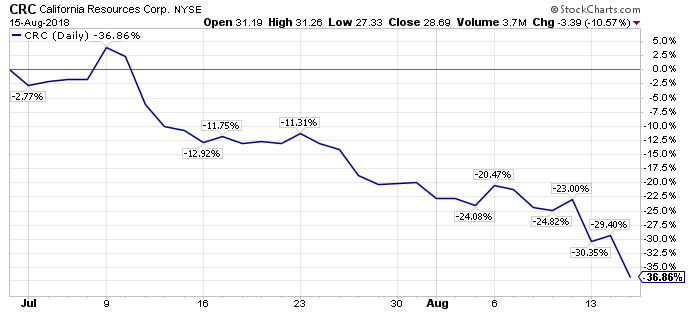
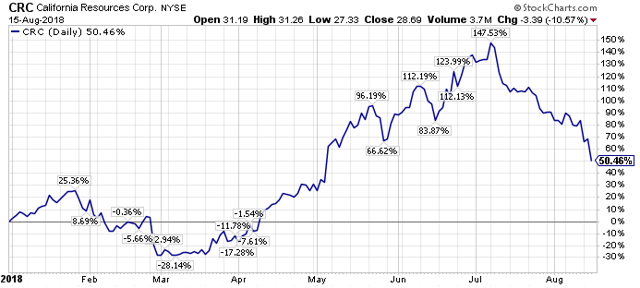
 Number 2 – California Resources Corp. (CRC) – Up 50.5% YTD, Down -36.9% from July 1st, 2018, through August 15th, 2018.
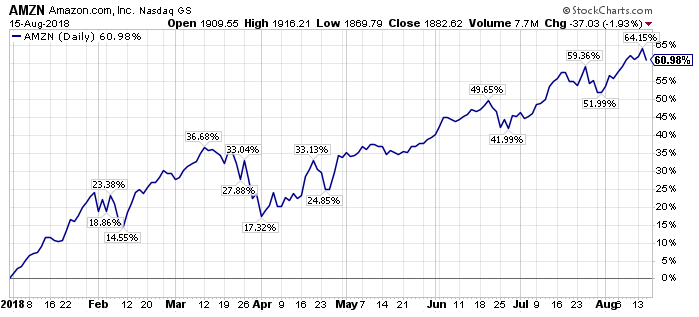
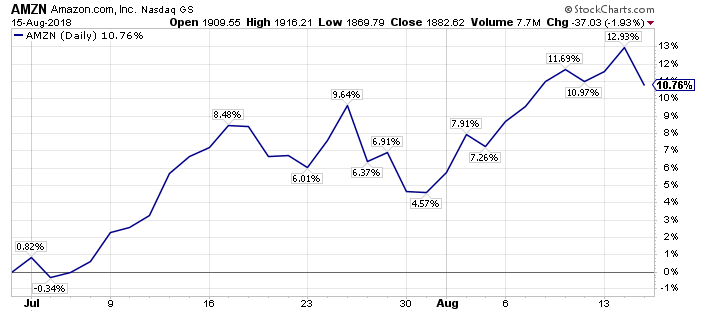
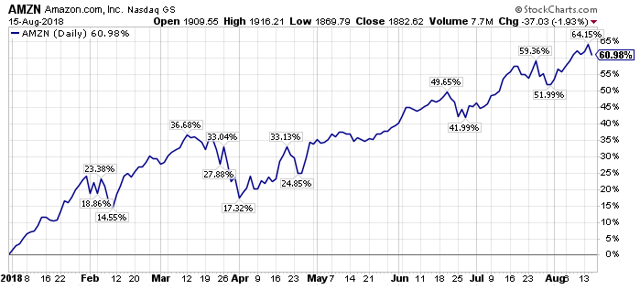
 Number 1 – Amazon – Up 61.0% YTD, Up 10.8% from July 1st, 2018, through August 15th, 2018.
 A couple of quick observations.
First, the performance differential between the highest and lowest returners is particularly noteworthy in 2018. When I used to work with Lee Ainslie of Maverick Capital, who is one of the best long/short money managers in the world, IMO, he would often remark on how wide the variance of performance was in the S&P 500 Index each year, and how this variance offered opportunity for a long/short manager.
Second, it is remarkable how strong the S&P 500 Index, and the NASDAQ have been, despite the sell-off in a large number of risk assets over the course of July, and August, thus far.
Third, earnings estimates have been rising for a number of U.S. equities, and rising earnings estimates, as we will delve into in the next section, is historically one of the factors that best influences equity prices in the near-term.
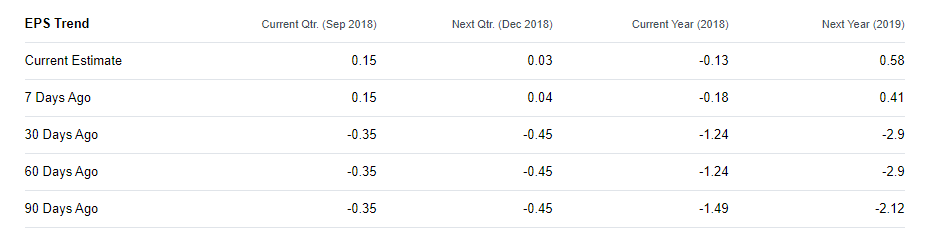
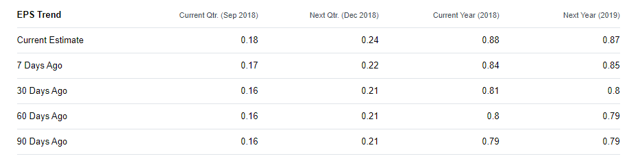
Fourth, some companies, with rising earnings estimates, like California Resources Corp, have still struggled since July 1st. CRC’s earnings estimates are shown below.
 Fifth, earnings are not everything, as Amazon has showed adroitly over the past decade. To his credit, Jeff Bezos has focused on operating cash flow, and cash flows are ultimately a better barometer than earnings, yet earnings still matter.
Earnings & Opportunity
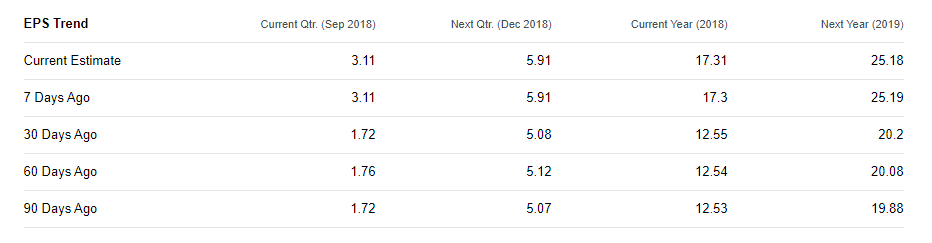
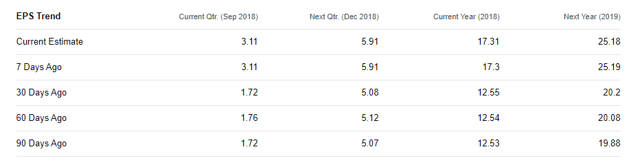
Amazon, which amazingly has a $936 billion market capitalization as I write this piece, has seen its shares surge higher in 2018 by 61.0%, propelled in part by rising earnings estimates, as shown in the table below. Now Amazon’s valuation metrics are still nowhere close to what a value investor would look for, however, there is no dispute that AMZN has grown, and is growing.
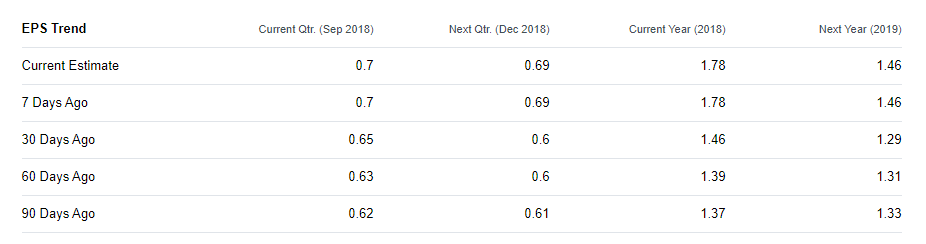
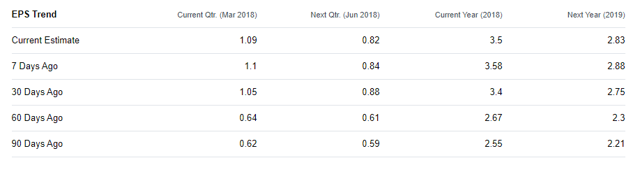
 Looking in the value basket of equities, Cleveland-Cliff’s, which occupied the #4 position on the June 5th, 2018 version of the Contrarian Top-Ten List, and which I wrote about in detail for members on May 30th, 2018, has risen 36.6% YTD, and 16.8% since July 1st, 2018, as earnings estimates have surged too, as the following CLF earnings estimates illustrate.
Building on this narrative, earlier today in Live Chat, I summarized a discussion I had with a former money manager over lunch, and both of us think CLF can earn over $2.50 this year (2018), so all the good news is not priced in by sell-side analysts yet, in CLF shares.
Simply judging by the stock prices of AMZN and CLF, rising earnings estimates have clearly boosted shares of AMZN, and CLF since July 1st, and over the course of 2018.
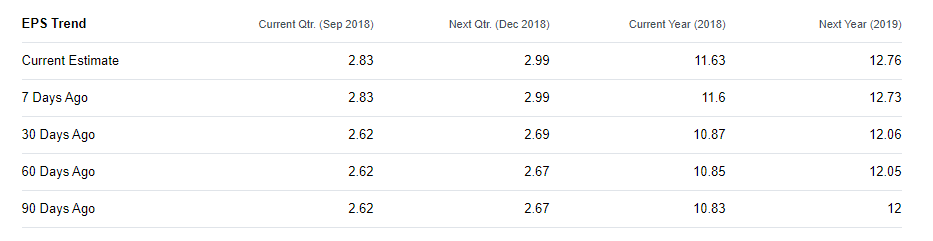
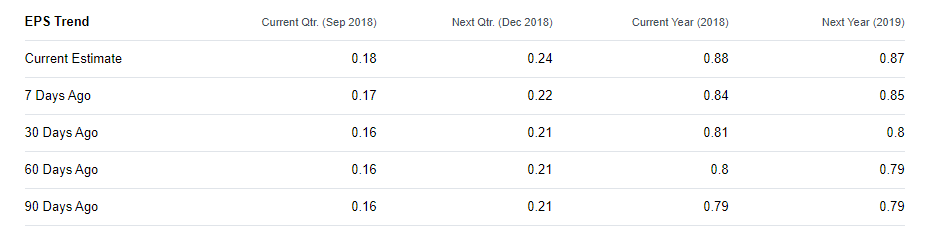
However, at the other end of the spectrum, U.S. Steel, which has seen its earnings projections for 2018 more than double from the beginning of the year, has seen its shares tumble, dropping -17.1% YTD, and -16.3% since July 1st, even as U.S. Steel’s earnings estimates have risen further, as shown in the table below.
 Is this divergence, a big opportunity in U.S. Steel shares?
I think the answer is yes, as I have written about in detail in an initial profile, and in a follow-up update for members.
The same opportunity, meaning a disconnect in the underlying equity price from rising earnings estimates, is available in Teck Resources Limited, as earnings estimates for TECK are up sharply from the start of 2018, yet its stock price is down -15.1% for the year. I am working on an updated deep-dive article on TECK. For now, TECK’s earnings estimates are shown below.
 Continuing the narrative, Caterpillar has seen its shares slide -14.9% YTD, even as its earnings estimates have been revised higher, as CAT’s earnings estimates below show.

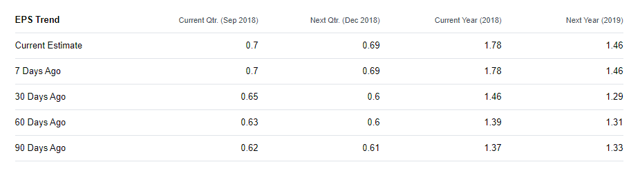
On the mid-cap company spectrum, Southwestern Energy, which remains my top current idea for buy-and-hold investors, as SWN is compounding capital at IRR’s above 30% even at today’s commodity prices, with a market capitalization of roughly $3 billion and an enterprise value of roughly $6 billion, has seen its shares decline roughly 9% YTD, even as its earnings estimates have risen. Here are SWN’s current earnings estimates.
 In summary, I think there are four very interesting ideas across the market-cap spectrum, where earnings are rising, yet the market has looked past this good news in the short-term.
Takeaway – Focus In On Companies That Have Upward Earnings Revisions But Diverging Stock Prices
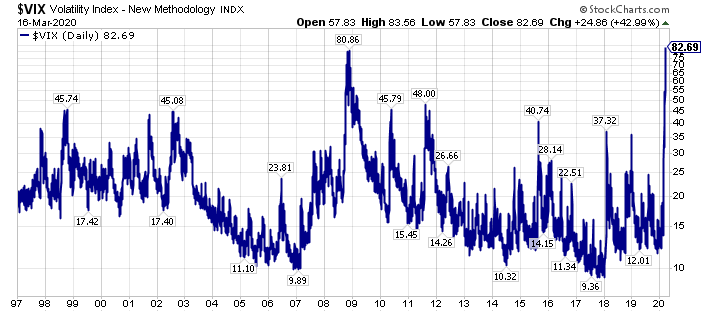
2018 has been very different than 2017, with volatility returning to the markets. This volatility has yielded opportunities, and it should yield future opportunities, however, it has also yielded unexpected challenges.
Specifically, there have been a number of equities that have seen earnings estimates revised sharply higher, which historically has been highly correlated with rising stock prices, yet many of these equities have seen negative diverging equity prices.
Is the market trying to tell us that the earnings peak is in for economically sensitive cyclical companies?
Perhaps, however, with U.S. GDP growth just now accelerating, I believe that we are still quite a distance away from the economic cyclical peak.
If this thesis is valid, then earnings for economically sensitive companies could still be on the upswing, and there very well could be a longer runway than investors and speculators imagine, making today’s share prices bargains.
Four ideas that have my attention right now with the sell-off in shares, alongside rising earnings, are Caterpillar, Teck Resources Limited, U.S. Steel, and Southwestern Energy.
Caterpillar has a roughly $80 billion market capitalization, and a roughly $108 billion enterprise value, so it clearly is a large-cap opportunity. Incidentally, earlier last week, when I wrote about Bausch Health Companies after its earnings, I talked about Chicago Equity Analytics, and CAT shares currently have the highest rating on their grading scale. The one negative for CAT, would be their long-term debt.
Teck Resources Limited, which also has the highest rating from Chicago Equity Analytics, has a current market capitalization of roughly $13 billion, and an enterprise value of roughly $17 billion. Teck, which is the second largest met coal producer in the world behind BHP, and also a major copper, zinc, and emerging oil producer is trading for roughly 3x EV/EBITDA, which is below its historical average of roughly 7x EV/EBITDA, so shares are very cheap on a relative and absolute basis.
Similar to Teck Resources Limited, U.S. Steel trades at roughly 3x EV/EBITDA, and U.S. Steel is on track to have a net cash positive balance sheet (cash minus debt) in the year ahead. U.S. Steel is rated the second highest rating by Chicago Equity Analytics, and its traditional valuation rations, like the price-to-earnings ratio, are eye opening cheap, with shares trading at roughly a 6x P/E multiple going forward.
Despite being an iconic steel company, and a one-time market leader in market capitalization, U.S. Steel only has a market capitalization today of roughly $5 billion, with an enterprise value of roughly $6 billion.
For perspective, the current leader in market capitalization (remember U.S. Steel is former leader) is Apple (AAPL), whose shares are up 25.7% in 2018, and AAPL shares have a market capitalization today over $1 trillion.
Last but not least, Southwestern Energy, a firm that has resided atop my list of high conviction ideas for over a year, and who is generating IRR’s of above 30% at today’s still downtrodden natural gas prices, has a market capitalization of roughly $3 billion, and an enterprise value of roughly $6 billion, small for one of the United States top-three natural gas producers over the past decade, and still a top-five natural gas producer today.
Hopefully this overview will give you some ideas. For me personally, it has helped to cement and define the unique opportunity at hand right now.
Looking forward to see the divergences resolved in a positive manner,
Travis

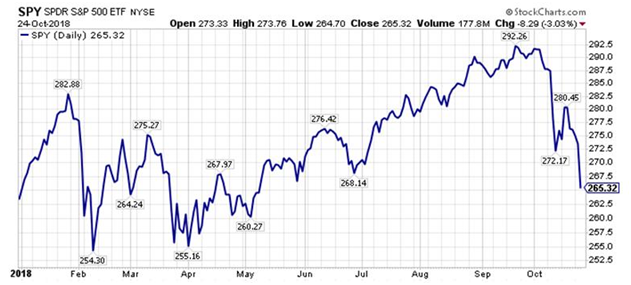
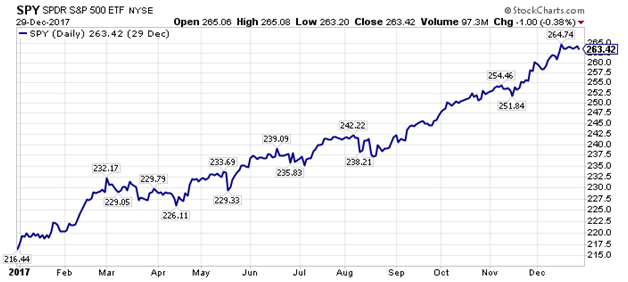 Looking at the charts above, clearly investors would prefer 2017 over 2018, though for me personally, 2017 was very painful, as I was on the other side of some one way trades, and frankly I destroyed capital.