
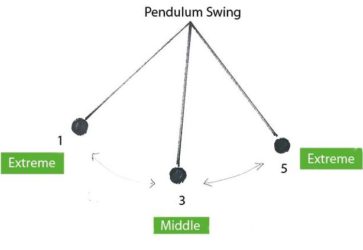
Conviction, engagement, and capital are important. Also, position sizing matters immensely. When you have a “fat pitch”, bet big, or said another way, bet the farm.
Commodity Stocks Historically Undervalued
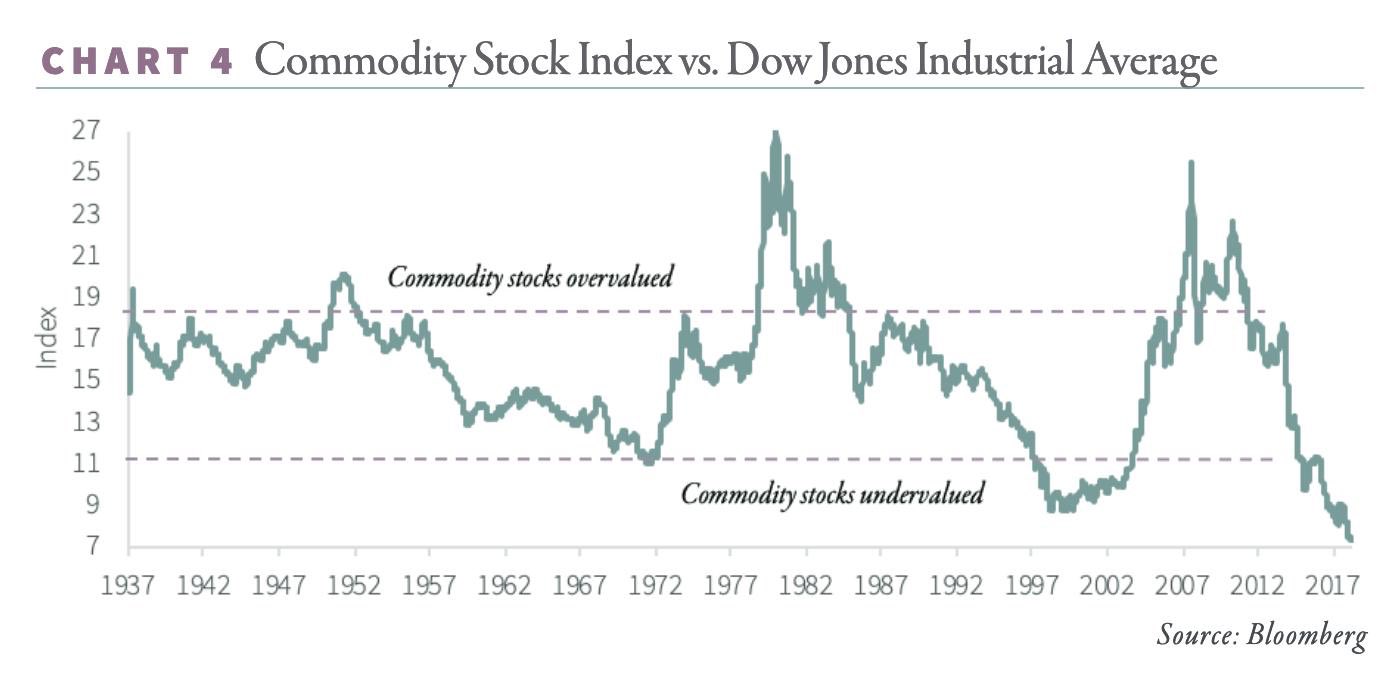
This has been my focus for a number of years, which has been to my detriment overall thus far, though 2020 seems to be the turning point, something I have referred to as the “Main Course” to 2016’s “Appetizer”.
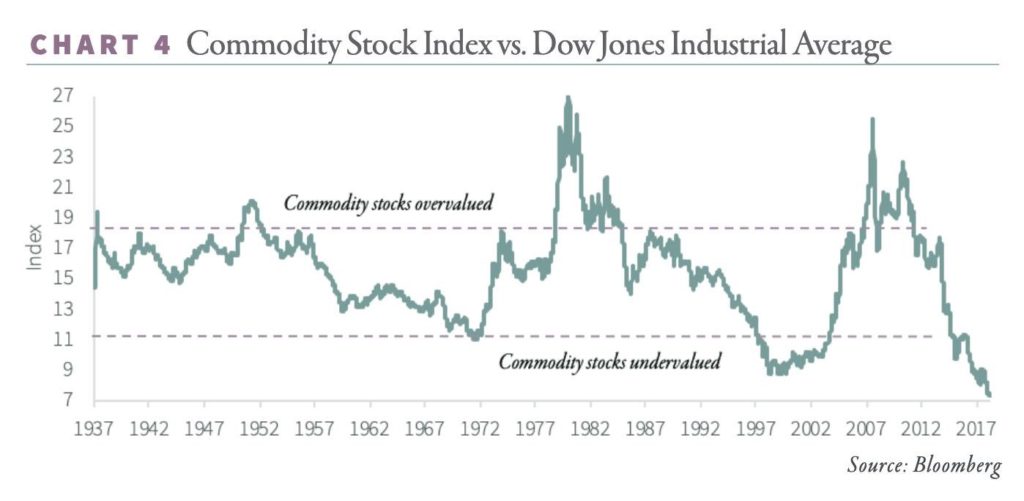
A lot of analysts talk about historic opportunity in the markets when discussing stocks or portfolio strategy, yet this is “the real McCoy”.
Dow Is Going To Get Saved With Apple (AAPL) Reverse Split
Yesterday, I wrote about Apple (AAPL) here on the blog, and over at Seeking Alpha with this article. At this juncture, I am bearish on AAPL shares, and think they could lose over 50% over their value.
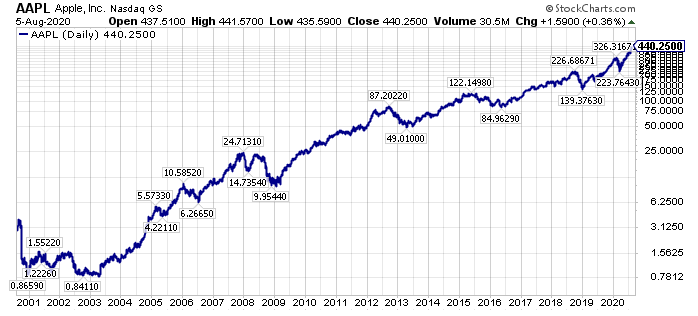
Somewhat ironically, the Dow Jones Industrial Average (DIA) is going to get saved from a big Apple share price decline by Apple reverse splitting it shares.
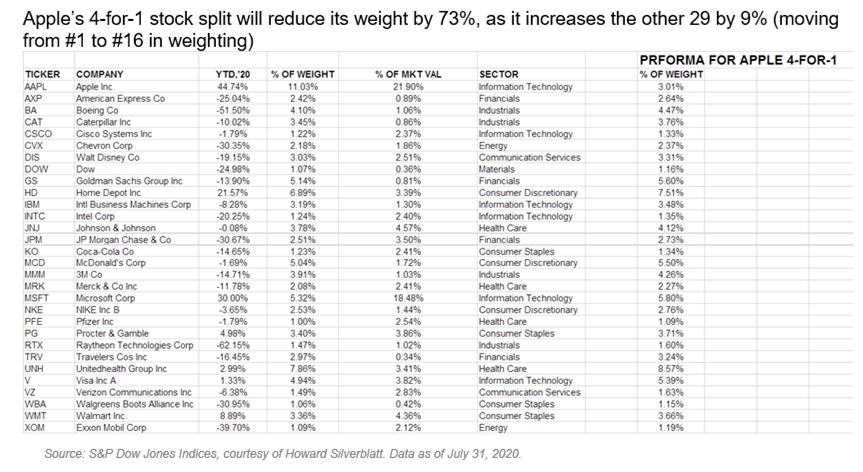
With the reverse split, Apple will go from the largest weighting in the Dow Jones Industrial Average to the 16th largest weighting.
This is a stroke of good luck for DIA holders, in my opinion.
Use Panic Selling To Your Advantage
Use Panic Selling To Your Advantage – Highlighting A 14% Yielding Model Portfolio
This article was originally written on February 27th, however, I am posting here for the archives.
Feb. 27, 2020 1:42 PM ET|11 comments |About: Brookfield Property Partners L.P. (BPY), MIC, SPY, XOM, XOP, Includes: BPYPP, GNW, OXY, SLB, SPG, SPG.PJSummary
Panic selling in the broader stock market may have just begun.
Under the surface, panic selling has been ongoing in selected sectors and stocks for an extended period of time.
This presents the historic opportunity.

Introduction
Often, I get the question of how I have achieved out-sized returns (and losses) in the past, particularly with an emphasis on what I have been able to do in my very good years, including 2016, 2003, 1999, 2000, 2008, 2010, and most notably 2009, as illustrated by the snapshot of an aggressive Portfolio that I managed personally for myself below, where I took roughly $60,000 in November of 2008 to over $3 million by November of 2009.
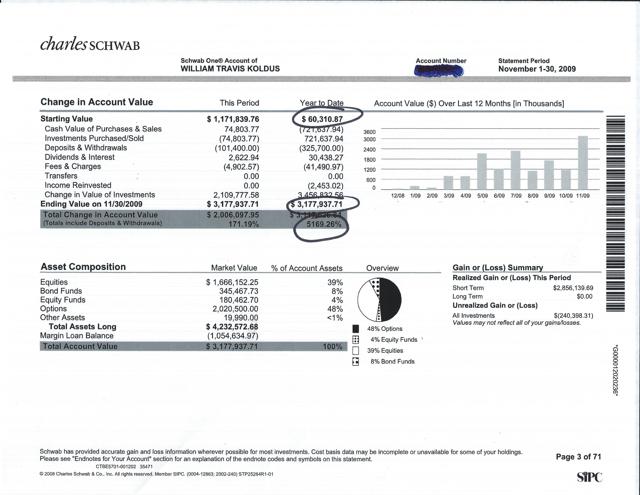
How did I achieve the above returns, over 5000% in a years time (which BTW I may never top, however, knowing this reality, does not stop the pursuit of good years, particularly at inflection points)?
There is a lot of complexity in the answer, including having a variant view, specifically on the broader market as measured by the S&P 500 Index (SPY), using some leverage to express this view, primarily via options, which can be very dangerous tools in inexperienced hands, and the willingness/ability to go against the grain.
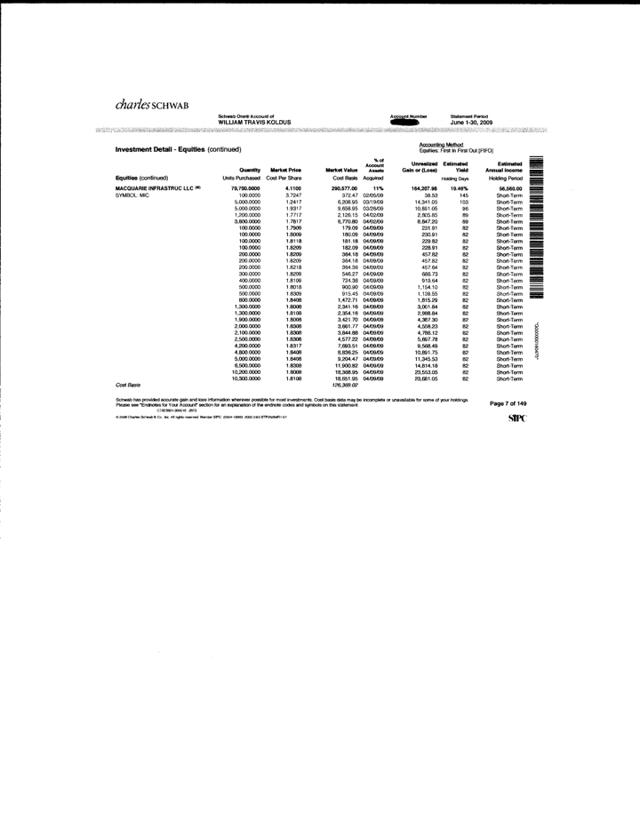
Having said this, there is also a lot of simplicity in the answer, specifically in the main underlying driver of the returns, which was buying significantly out-of-favor equities, with one example being my March 2009 and April 2009 purchases of Macquarie Infrastructure (MIC) for roughly $2 a share. Famously, MIC got down to $0.79 (before dividend adjustments…so I was down roughly 60% on even what I thought were bottom ticking purchases…think about that for a minute) and topped $80 per share, again before dividend adjustments, while also reinstating a substantial dividend, that has been roughly $1 per quarter for some time now (this dividend had been suspended in 2009 before being reinstated).
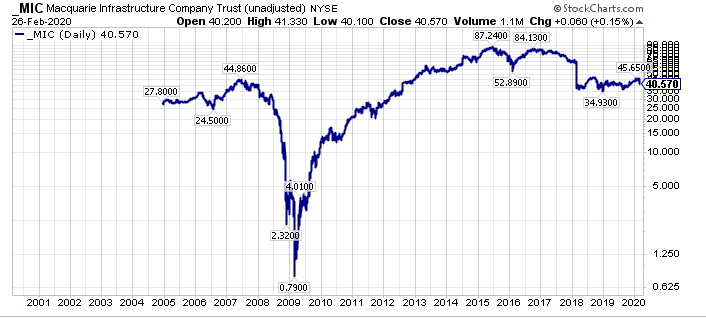
Clearly, with the benefit of hindsight, purchasing MIC at the lows was a generational investment opportunity, however, it was not easy at the time, even though I had done thousands of hours of due diligence on the company, similar to the focused due diligence effort I have done today, on out-of-favor, undervalued securities.
The key was buying into the panic selling, taking advantage of the panic, and I think we are seeing similar levels of opportunity today, just not in the places that most investors want to look.
Buying Into The Panic
In my November 2008 to November 2009 example above, I actually started buying what I felt were the most distressed, highest return potential candidate equities in 2008, in the heart of the panic. Remember, the broader equity market did not bottom until March of 2009, which is a whole other story, however, the important point is that some of the most downtrodden equities made their lows prior to the broader market making its lows.
One specific example, is General Growth Properties, the former second-largest mall REIT in the U.S. behind Simon Property Group (SPG), that was eventually acquired by Brookfield Property Partners (BPY) in 2018.
In November of 2008, I was on a due diligence trip through South Florida, meeting with hedge fund managers, and asset managers, and after a legendary night out for this generally non-party owl author (ask me for details if you want), I awoke in my Miami Beach hotel room, looking out at the ocean, and taking in the panic, eventually buying 120,000 shares of GGP on November 14th, 2018 for this specific account, as my brokerage account statement shows (if you want additional details send me a direct message).
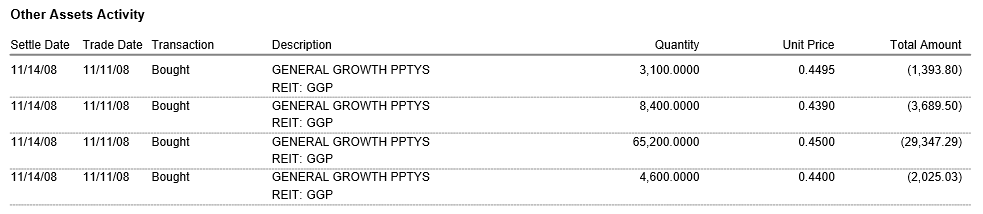
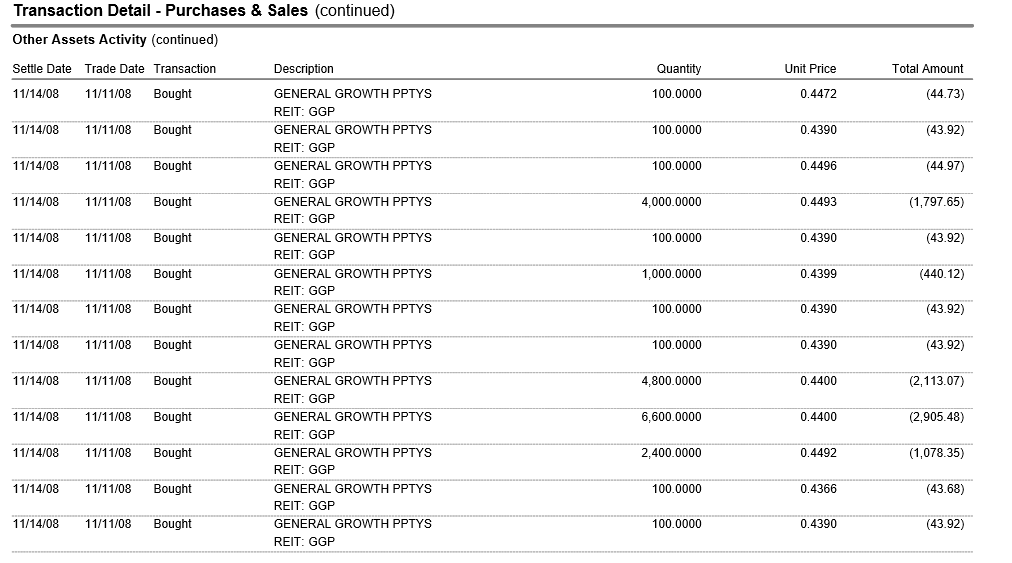

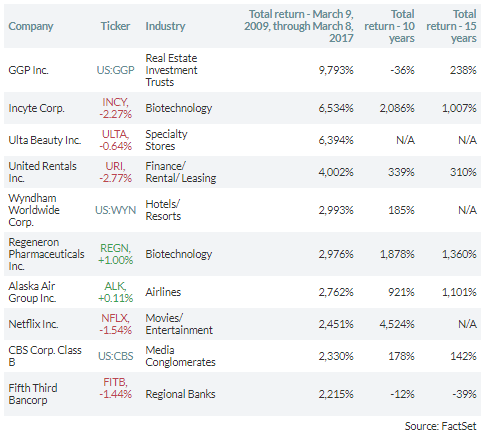
These purchases, in aggregate, totaled $53,593.71, which was not a big dollar total in aggregate, however, the 120,000 shares were a nice stake in what would become the best performing S&P 500 equity in the bull market, at least through March 10th, 2017, as this CBS MarketWatch article on the bull market turning 8 years old chronicled.
In March of 2018, in the Brookfield Property Partners deal, these shares could be exchanged for $23.50 in cash.
Not a bad return at all, however, the key was to buy into the panic.
Where Is The Panic Today
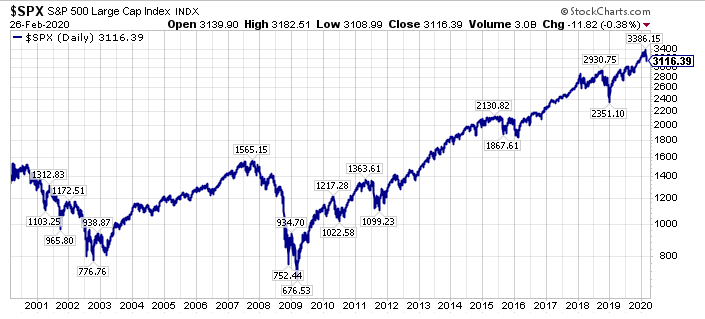
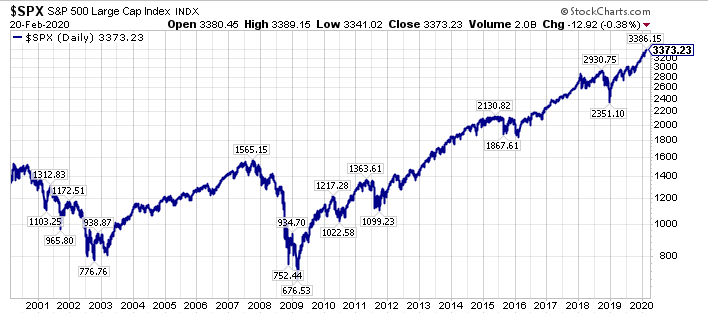
Even though the S&P 500 Index is on track to be down 7% or more this week, as I write this post, the real panic is not in the broader stock market, at least not yet.
In fact, on a long-term chart, the recent decline is just a blip.
Now, we could be on our way to a broader stock market sell-off, as GMO has previously outlined earlier in 2018.
Regarding the path of the broader markets, that is yet to be determined, as we grapple with historically extended valuations, and historical monetary policy accommodation levels.
The real panic right now is in the underbelly of global economic activity, specifically in economically sensitive cyclical stocks, and more specifically, in the most loathed of all stock market sectors today, which is of course, the energy sector.
The SPDR S&P Oil & Gas Exploration & Production ETF (XOP) offers a glimpse of this panic, with XOP down 79.8% from its 2014 high, and down 63.8% from its 2018 high.
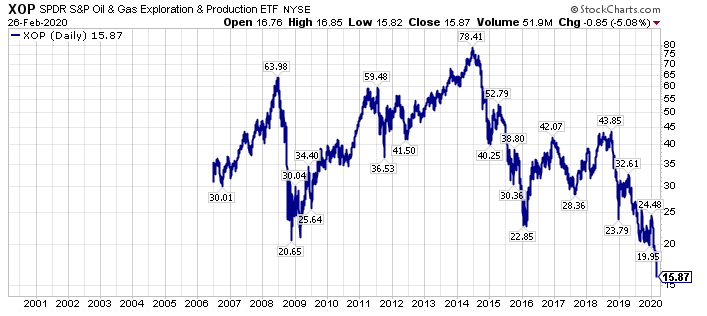
Thus, with the broader U.S. stock market, as measured by SPY, only down roughly 8% from its recent highs, the compare & contrast should be eye opening for most investors.
Building on the narrative, with our deep research dives, we feel there are a number of out-of-favor equities that are down even greater in percentage terms, which offer even greater relative and absolute opportunity.
Importantly, similar to several of the downtrodden equities I purchased in late 2008, and early 2009, including General Growth Properties, and Genworth Financial (GNW), which was also bought well below $1 in November of 2008 before shares rebounded above $18 by early 2010, the most out-of-favor, undervalued equities right now, will probably bottom ahead of the bottom in the broader equity market.
Panic Selling Is Yielding Opportunity
It is no secret that I am targeting what I believe are the most undervalued securities, with the goal of creating a generational wealth opportunity. These securities are generally loathed, unloved, and scorned right now, and many of these equities would make your stomach turn looking at long-term charts, part of the reason there is so much opportunity.
While the best opportunities are generally in smaller capitalization names, there is opportunity in large-caps, including in energy stalwarts like Exxon Mobil (XOM), Occidental Petroleum (OXY), and Schlumberger (SLB), all of which offer attractive yield-oriented income opportunity.
These three securities are part of a “Stuck On Yield” Model Portfolio, which is a $100,000 portfolio, that I created on Friday, February 21st, for a family member.
This Portfolio is yielding over 14% right now, and I have done deep-dive due diligence on all its member components, a majority of which are from the target rich energy sector.
Members of The Contrarian can see this Model Portfolio here, and I have sent out emails of this Portfolio to members of my research services, and I will be making it available this week for all my research members.
Closing Thoughts – Be Ready To Buy Now
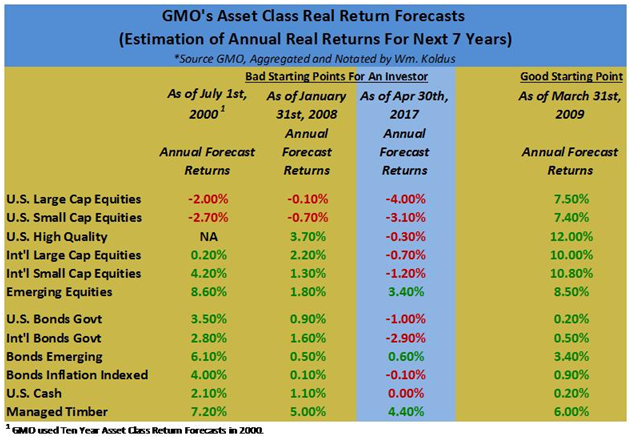
Nobody, including me, really knows where the stock, bond, and commodity markets are headed right now with certainty. All we have is probabilities, and ultimately, our valuation analysis. The latter is crucially important, as buying the most undervalued assets, ultimately leads to the strongest returns, so long as you can ascertain the underlying asset quality, and survivability of the corporate entity.
On this note, I am going to make mistakes, so the key is getting a handful of these right, as the gains from the survivors will more than make up for any losses, at least that is my past experience at previous inflection points. Ultimately, valuation matters, and starting valuations levels matter too. Adding to the narrative, with everyone wanting to own quality today, there are many “Have Not” securities that are historically undervalued.
Conversely, a high valuation is a bad starting point, and buying overvalued assets, which certainly describes the S&P 500 Index, which trades at greater EV/EBITDA, Price/Book, and Price/Sales multiples that it did at its peak valuation levels in late 1999/early 2000, is a recipe to achieve poor returns going forward. Adding salt to the wound, the bond market, which offers meager sovereign yields, is also set-up for poor future returns over the longer-term, as historically over 90% of bond returns are correlated with starting yields.
In summary, buy what is cheap, and buy into the panic, as the cheapest valuation equities with the best future return prospects will often rebound ahead of a bottom in the broader equity market.
Specific to my research services, I am offering a 20% discount to membership (I am extending this through March) to “The Contrarian” (past members can also direct message me for a special rate), the lowest price point since the founding members price, where we have a live documented history dating back to late 2015..
Additionally, I am offering a limited time 50% discount for the first 5 new members (I expect these slots, some of which I view as a stepping stone to “The Contrarian”, to fill up fast as they have done previously) to a host of research options, including a lower price point. If you subscribe to a premium option (I have had one concierge slot open up after a gentleman I was speaking to last evening held off on taking this slot), I will set-aside time for a personal phone call to get up to speed. To get these offers, go here, and enter coupon code “opportunity” without the quotes.
Reach out with any questions via direct message (I enjoy the dialogue at market inflection points).
Via my research services, or another avenue, please do your due diligence, and take advantage of what I believe is a historic inflection point, which I believe will supersede 2000-2002 in the growth-to-value rotation.
WTK
P.S. Resilience is perhaps the most important ingredient to be successful in life, and in the markets. Keep that in mind right now.
Disclosure: I am/we are long MIC, OXY, SLB, xom and short spy in a long/short portfolio.
Additional disclosure: Every investor’s situation is different. Positions can change at any time without warning. Please do your own due diligence and consult with your financial advisor, if you have one, before making any investment decisions. The author is not acting in an investment adviser capacity. The author’s opinions expressed herein address only select aspects of potential investment in securities of the companies mentioned and cannot be a substitute for comprehensive investment analysis. The author recommends that potential and existing investors conduct thorough investment research of their own, including detailed review of the companies’ SEC filings. Any opinions or estimates constitute the author’s best judgment as of the date of publication, and are subject to change without notice.
Parallels Of Index Funds To Subprime CDO’s
This article, that I wrote on September 5th, 2019, seems particularly relevant right now (click for the link to this article here).
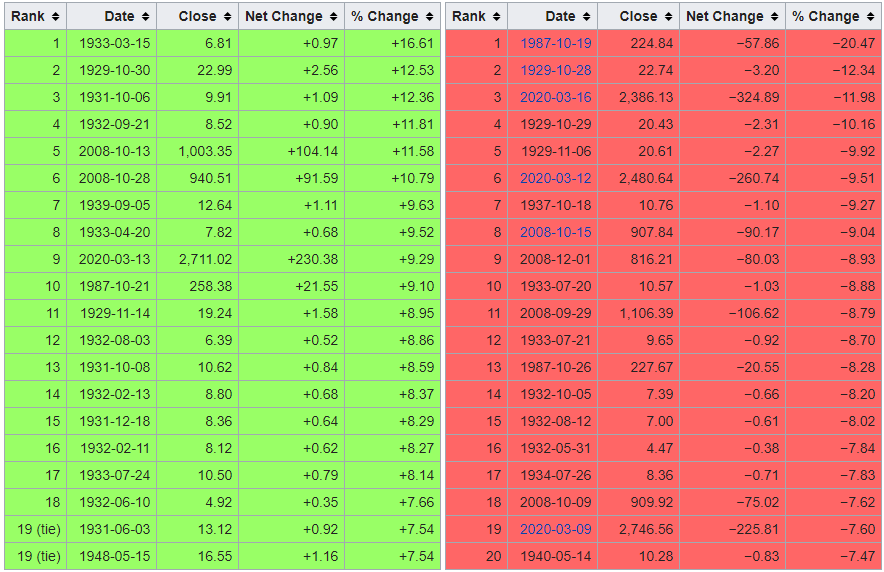
Volatility Is Above 2008 High Levels As Dow Jones Industrial Average Has 2nd Worst Percentage Decline
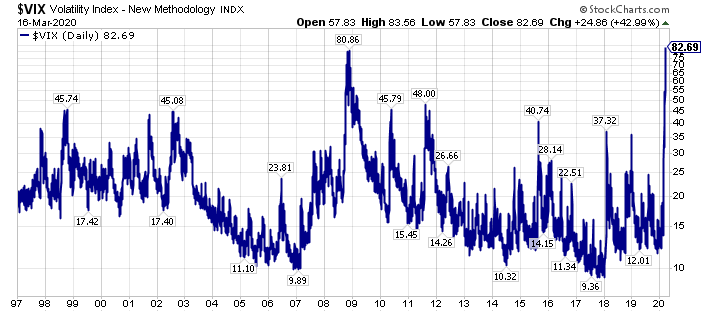
This is just a short post to document something remarkable.
Volatility is actually above 2008’s high levels.
With the Dow Jones Industrial Average (DIA) posting is second worst percentage decline ever, and a cluster of recent days on the worst performing days list, perhaps the jump in volatility amid the COVID-19 pandemic should not be a surpise.
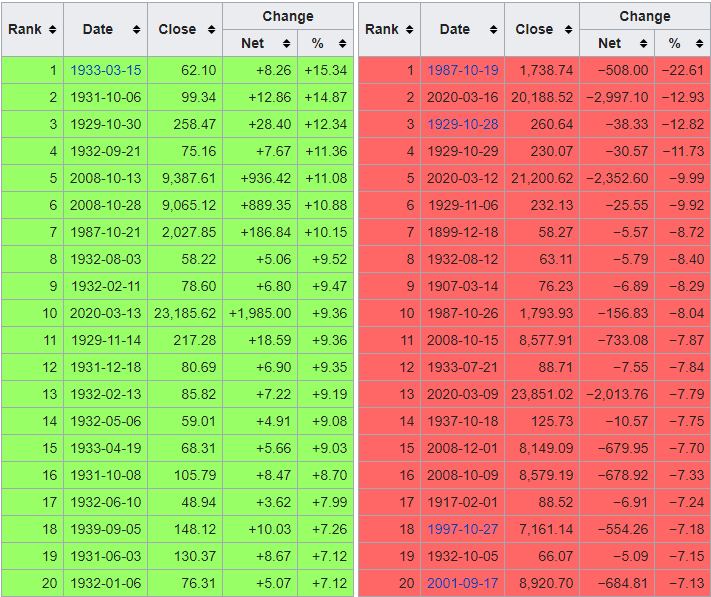
Adding to the narrative, the S&P 500 Index (SPY) posted its third worst percentage decline day ever.
Ultimately, volatility is opportunity, and this elevated volatility will not be around forever. Thus, I think market participants should be making their shopping lists for what to own on the long side.
Everything Is A Function Of Interest Rates

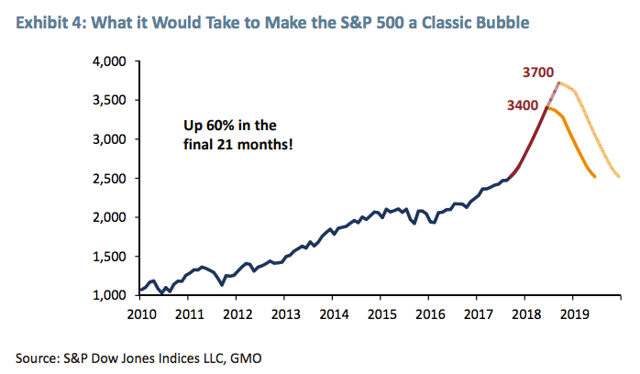
We have clearly followed the path of the classic bubble that GMO laid out in 2008 for the S&P 500 Index ($SPX), (SPY), which is shown below.
The timeline has been slightly different, I call it an extended classic bubble, the slower ride to the final destination. Regardless of the course, we are here now.
The key question is where do we go from here, and the answer, from my perspective, is all a function of interest rates, particularly longer-term sovereign interest rates. With the yield curve close to inverting again, and two Fed Funds rates cuts priced in right now as of this writing (February 21st, 2020) through the December 2020 FOMC meeting, a lot of pessimism is priced in.
Additionally, sovereign interest rates are so low, the question needs to be asked, “How much could they go down in the next recession?”
Last, but not least, what if a recession is averted, or we experience a mild recession, similar to what happened in the midst of the 2000-2002 bear market. On this note, the current investment landscape reminds me an awful lot of late 1999/early 2000, with the moonshot blow-off in Tesla ($TSLA), and the greater concentration in the top-five S&P 500 names ($SPY), which are Apple ($AAPL), Microsoft ($MSFT), Alphabet ($GOOGL), ($GOOG), Amazon ($AMZN), and Facebook ($FB) than in late 1999/early 2000.
We all know how that story ended, however, almost all market participants have forgotten that 2000-2002 time frame, hyper-focused on a fear of a reprisal of 2007-2009, which has led us to where we are today.
And where is that, you may ask?
The answer is that we are on the cusp of a historical capital rotation. Stay tuned.
Long/Short Investing
(Travis’s Note: This article was originally published on July 16th, 2017, and it is being re-posted today, October 28th, 2018, to organize for the archives. Long/short has had a very difficult past decade, but I believe it is primed for a very good decade ahead).

The past several days, I have been working on an article for members of “The Contrarian”, that reviews a generational hedge fund call from 2013, and why this call remains relevant today.
In going through my archived writings, I came across an article I wrote on long/short investing in January of 2016, and I wanted to highlight a portion of that article, specifically my comments on long/short investing.
Here is the excerpt from the January 2016 article:
Reflection On My Long/Short Investment Philosophy
Ever since I learned about Alfred Winslow Jones, the pioneer of hedge fund investing, I was fascinated by the long/short investment strategy. Ideally, it performed well in up- and down-market environments, and separated stock picking skill from general market movements.
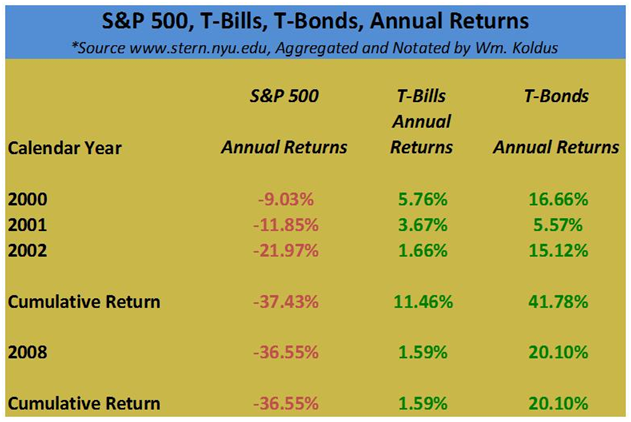
During my early career as an investment analyst, I focused on value-oriented investment managers and their philosophies. Some of my favorite investment managers were Mason Hawkins, Marty Whitman, Bob Rodriguez, Dan Fuss, and Jean-Marie Eveillard. Reading their analysis and following their investment strategies influenced and shaped my thinking. The 2000-2002 time frame reinforced my value leaning, as value managers, especially the aforementioned ones, strongly outperformed, as the S&P 500 Index declined nearly 40%.
In contrast to 2000-2002, the dramatic downturn of 2008 treated value investors far differently. Many value investors piled into financial stocks as they declined, attracted by the relatively and historically cheap valuations. Trying to buy value investments in 2008 was akin to catching a falling knife, similar to buying commodity stocks over the last three years (Author’s Updated Note: commodity stocks had a historic reversal and rebound in 2016), and many value-oriented investment investors and firms went out of business.
The tremendous volatility of 2008 also negatively impacted long/short equity hedge fund managers. From my perspective covering hedge fund managers at the time, many long/short portfolios experienced historic volatility and drawdowns, especially in the second half of 2008, particularly in the months of October and November. Observing how these managers responded, reducing gross and net exposure, and emphasizing their highest conviction investments, was an invaluable learning experience.
During 2008/2009, I kept my eyes fixated upon the performance of a select few hedge fund managers. One firm that I followed closely for personal and business reasons was Lee Ainslie’s Maverick Capital. Lee Ainslie, one of my favorite investors, is a descendant in the lineage of the legendary Julian Robertson (another one of my favorite investors), and he sparked my curiosity with how his team structured Maverick’s portfolios. Maverick was founded in 1990, and since inception, it has focused on long/short equity investing, eschewing macro, currency, and interest rates bets.
Part of my attraction to Maverick’s investment philosophy was that it was different from my own investment philosophy. Personally, I have always liked macro forecasts and the trading and investing opportunities that they inspire. My strong 2008 and 2009 performance years were largely the result of my macro market views. Because of their love for macro investing, I have been drawn to investors like Stanley Druckenmiller or John Burbank of Passport Capital, and they have heavily influenced my investment philosophy.
To summarize, value investing, long/short investing, macro calls, and a general contrarian stance have all become critical components of my personal investment philosophy. The struggles I have endured trying to buy historically cheap commodity stocks over the last several years has scared me, and caused me to at least consider a worst-case scenario more than I did prior to this experience (Author’s Updated Note: It has also caused me to heavily research the capital cycle, and members of The Contrarian will know what I am referring to specifically).
The resulting compilation of investment philosophies has been mashed together to produce the Contrarian All Weather Portfolio, my version of a long/short portfolio (Author’s Updated Note: This portfolio has has material out-performance since its December 7th, 2015 inception despite the robust performance in the U.S. stock market). At its heart, stock-picking results, netted out by a SPDR S&P 500 ETF (SPY) hedged position, will drive the returns of the portfolio. A majority of the individual stock selections are value oriented in some fashion. Additionally, there will be a macro theme to the portfolio alongside some macro positioning at the margin.
Takeaway: Long/Short Investing Is More Timely Today
Similar to the late 1990’s, which culminated in a period where growth outperformed value for roughly ten years, the past decade has also seen growth outperform value ironically from 2008 through today, in an environment where stock and bond valuations have become historically extended.
The end result is that expected future real returns today, for both stocks and bonds, are some of the lowest projected real returns in history.
Additionally, with bond yields low in nominal terms, the next significant market correction in U.S. equities, will not see investors saved by bond out-performance, in my opinion.
To close, there is a high probability that a traditional “60/40” equity/bond portfolio or “70/30” equity/bond portfolio will have negative real returns over the next decade. All investors should think about today’s starting valuations when constructing their portfolios.
William “Travis” Koldus
Disclosure: I am/we are short SPY.
Additional disclosure: SPY short is a hedge position to offset long investments in a long/short portfolio. Every investor’s situation is different. Positions can change at any time without warning. Please do your own due diligence and consult with your financial advisor, if you have one, before making any investment decisions. The author is not acting in an investment adviser capacity. The author’s opinions expressed herein address only select aspects of potential investment in securities of the companies mentioned and cannot be a substitute for comprehensive investment analysis. The author recommends that potential and existing investors conduct thorough investment research of their own, including detailed review of the companies’ SEC filings. Any opinions or estimates constitute the author’s best judgment as of the date of publication, and are subject to change without notice.
My Best Trade Ever, So Far
(Travis’s Note: This article was originally posted on July 8th, 2015, however, the trades described were made late in 2008, and early in 2009. One learning lesson from this experience, is that if you buy a deep value equity, and you are right, and the situation resolves bullish, your price targets in the depths may be way too conservative, and it is probably better to hold on to this uncovered treasure longer than you think at the time of purchase).
Purchasing Macquarie Infrastructure (MIC) in the first half of 2009 has been the best equity trade of my career thus far:

Dow Theory – My Market Historian History Lesson

(Travis’s Note: This post was originally written on May 29th, 2015, and I am re-posting it today, October 28th, 2018. Interestingly, both the Transportation Average (IYT), and the Dow Jones Industrial Average (DIA) are both below their 200-day moving averages today, as I write this post, so that is a nail in the coffin for the current bull market).
Dow Theory
Dow Theory takes its name from Charles H. Dow, pictured above, the co-founder of Dow Jones & Company, alongside Edward Jones and Charles Bergstresser. Investors should be familiar with at least two of those three names. It amazes me the longer I write and study market history, how intertwined today’s company names are with important historical figures. Similar to myself, Charles Dow was a historian, and a market historian. He was a firm believer in capitalism, and he frequently used the term “raw capitalism”. He aimed to report the facts objectively, and later in life, he consistently warned his reporters against accepting bribes for free stock promotion, which was common in the 1890’s, and remains common today. At the start of his writing career with the Providence Journal, he specialized in articles on regional history, focusing on New England towns, and the resulting investment implications.


He achieved notoriety for his famous “Leadville Letters”. I have posted pictures of Leadville, above, form the late 1800’s and early 1900’s. Dow’s writings from Leadville were based on an expedition Dow took to Colorado in 1879. He traveled to Leadville by train, over the course of four days, to report on the mining boom that was taking place in Colorado. Eventually Dow left his position writing for the Providence Journal, to head to New York City, where he founded the company that bears his name in 1882. On July 8th, 1889, Dow Jones & Company published the first issue of the Wall Street Journal. Market historians will probably find it interesting that Charles H. Dow ultimately sold his shares of his company in 1902 to Clarence Barron, and that is why the Wall Street Journal and Barron’s are sister publications today.
Charles H. Dow was the featured editorial writer in the Wall Street Journalfrom 1889 till 1902. During this time, he popularized the Dow Jones Transportation Average, which he had originally created in 1884, at his predecessor publication titled the Customer’s Afternoon Letter. The original Dow Jones Transportation Average contained nine railroads and two industrial companies. This index was a predecessor to the Dow Jones Industrial Average, which was formally published for the first time in 1896. Charles H. Dow used these new averages to help identify bull and bear markets. If both averages made a new high, it confirmed that a bull market was underway, from his perspective. However, if their was a divergence, that was a warning sign. Additionally, if both averages made a low, that signaled a bear market.