Commodity Stocks Historically Undervalued

This has been my focus for a number of years, which has been to my detriment overall thus far, though 2020 seems to be the turning point, something I have referred to as the “Main Course” to 2016’s “Appetizer”.

A lot of analysts talk about historic opportunity in the markets when discussing stocks or portfolio strategy, yet this is “the real McCoy”.

Natural Gas Equities Are Leading & They Are Just Getting Started

The broader equity market bottomed on March 23rd, 2020, and since then the SPDR S&P 500 Index ETF (SPY) is higher by 29.1%, and the Invesco QQQ Trust (QQQ) is higher by 34.8%, as shown in the chart below.

Somewhat inconspicuously, precious metals equities, as measured by the VanEck Vector Gold Miners ETF (GDX), have risen 73.0% since the March 23rd broader market low, energy equities, as measured by the Energy Select Sector SPDR Fund (XLE) and the SPDR S&P Oil & Gas Exploration & Production ETF (XOP), have risen 52.1% and 62.0%, respectively, from the March 23rd broader market low, and basic material stocks, as measured by the SPDR S&P Metals & Mining ETF (XME), which have risen 39.5% since the March 23rd broader market low.

Said another way, inflation sensitive and economically sensitive equities are quietly outperforming.

Leading the pack above, all, are natural gas equities, led by Antero Resources (AR), which I have previously called a generational buying opportunity.

At the time of this publication, I was routinely mocked, much as I was in 2008 and 2009, before this happened.

How did I achieve this performance?

Simply put, it was buying undervalued equities, like General Growth Properties, in November of 2008, that almost nobody else wanted.

As I have said previously, these purchases, in aggregate, totaled $53,593.71, which was not a big dollar total in aggregate, however, the 120,000 shares were a nice stake in what would become the best performing S&P 500 equity in the bull market, at least through March 10th, 2017, as this CBS MarketWatch article on the bull market turning 8 years old chronicled.

In March of 2018, in the Brookfield Property Partners deal, these shares could be exchanged for $23.50 in cash.

Not a bad return at all, however, the key was to buy into the panic. That is the same thing we have done this time, and now we will see if the proverbial Main Course plays out in front of our eyes.

Best of luck to everyone. Stay healthy, safe, and happy,

WTK

EQT Corp Up 49.1% Last Week; Inflection Point Is Here

EQT Corp Up 49.1% Last Week; Inflection Point Is Here

Mar. 17, 2020 8:54 AM ET|About: Antero Resources Corporation (AR)EQTSPYUNGXOMSummary

EQT Corp, the largest dry natural gas producer in the U.S., gained 49.1% last week.

Many natural gas equities had stellar performance weeks, while SPY dropped 9.5%, and historic volatility engulfed the markets.

Looking through the volatility, the inflection point is clearly at hand.

Introduction

There has been historic volatility in the financial markets.  That is not hyperbole, as the chart of the $VIX shows below.

In fact, even though the SPDR S&P 500 ETF (SPY) declined 9.5% last week, we have seen daily price moves, on a regular basis, that exceed that move.

In this swirling sea of turmoil, one sector that I have extremely bullish on stands out.

Specifically natural gas, and more specifically, the historically downtrodden natural gas equities, which have both been contrarian trades and investments even for contrarians.

Dry natural gas prices rose 9.4% last week, the United States Natural Gas Fund (UNG) rose 10.7% last week, and the largest dry natural gas producer in the United States, EQT Corp (EQT), rose 49.1% last week.

Macro Is Turning Sharply To Favor Natural Gas

Anybody that has been reading my work knows that I have been extremely bullish on natural gas prices and natural gas equities.

Why?

In a nutshell, both lower 48 dry natural gas production and liquids production are rolling over, as the charts of my colleague Lothar Grall illustrate.

(Source: Lothar Grall, The Contrarian)

Keep in mind, this data is from the EIA’s Drilling Productivity Report, and production was already in decline for dry natural gas and rolling over for liquids before COVID-19 became a full blown pandemic, and Russia and Saudi Arabia got into a full scale oil war.

The latter has cratered crude oil prices, and effectively rendered obsolete the primary bearish natural gas thesis, which was that unending associated dry gas production growth would forever impair dry natural gas prices.

Natural Gas Equities Have A Contrarian Surge

Again, last week, with the SPDR S&P 500 Index down 9.5%, the largest natural gas producer in the United States, EQT Corp (EQT), surged higher by 49.1%.

That is a monumental move, in a week of historical market volatility, and adding to the narrative, many of the leading dry natural gas producers had a strong week of relative, and absolute, price performance.

As this narrative begins to flow through to market participants, there is potential for extraordinary gains, perhaps even a generational wealth opportunity, as I wrote about in an article highlighting Antero Resources (AR) recently, in some of the largest dry natural gas producers in the table above.

On this note, much beleaguered Exxon Mobil (XOM), which is widely ridiculed for their XTO energy purchase in 2009, which gave them greater natural gas exposure, could get a material, unexpected (by many market participants) boost from higher dry natural gas prices.

Closing Thoughts – Take Advantage Of What I Think Is A Historic Opportunity

Many always ask me how I had a year like I did from November of 2008 to November of 2009.

The answer was really simple.

1. Have an accurate bigger picture macroeconomic view.

2.  Identify opportunities that are mispriced by the markets.

3.  Take advantage of the panic selling.

Fortunately, for market participants today, we have all the ingredients necessary for one of the great contrarian inflection points of all-time.

For members of my research services, I have published several recent pieces quantifying the historical volatility and the opportunity as follows:

Chronicling Another Historic Day In The Market & Putting Together A Buy List

Another Historic Market Day This Week – Chronicling Black Thursday & Looking Forward

Chronicling A Historic Day In The Stock Market & A More Historic Day In The Energy Market

(Note: Members can click on these articles to access.  Also, the first article is still being distributed).

Somewhat unbelievably, we have had three historic days in the stock markets in the past six trading sessions, really four historic days counting Friday’s big gains, so the volatility is incredible.

Seeing through all of this volatility, there are clear inflection points at hand, and the relative and absolute opportunity right now is as big as I have seen in my 25 year plus personal and professional investment career.

In summary, buy what is cheap, and buy into the panic, as the cheapest valuation equities with the best future return prospects will often rebound ahead of a bottom in the broader equity market.

Specific to my research services, I am offering a 20% discount to membership (I am extending this through March) to “The Contrarian” (past members can also direct message me for a special rate), the lowest price point since the founding members price, where we have a live documented history dating back to late 2015.

Additionally, I am offering a limited time 50% discount for the first 10 new members (I expect these slots, some of which I view as a stepping stone to “The Contrarian”, to fill up fast as they have done previously) to a host of research options, including a lower price point. If you subscribe to a premium option (I have had one concierge slot open up), I will set-aside time for a personal phone call to get up to speed. To get these offers, go here, and enter coupon code “opportunity” without the quotes.  Either way, once you sign up, I will follow-up with a welcome email within a day.

Reach out with any questions via direct message (I enjoy the dialogue at market inflection points).

Via my research services, or another avenue, please do your due diligence, and take advantage of what I believe is a historic inflection point, which I believe will supersede 2000-2002 in the growth-to-value rotation.

WTK

P.S. Resilience is perhaps the most important ingredient to be successful in life, and in the markets. Keep that in mind right now.

Disclosure: I am/we are long AR, EQT, UNG, XOM, and short SPY in a long/short portfolio.

Additional disclosure: Every investor’s situation is different. Positions can change at any time without warning. Please do your own due diligence and consult with your financial advisor, if you have one, before making any investment decisions. The author is not acting in an investment adviser capacity. The author’s opinions expressed herein address only select aspects of potential investment in securities of the companies mentioned and cannot be a substitute for comprehensive investment analysis. The author recommends that potential and existing investors conduct thorough investment research of their own, including detailed review of the companies’ SEC filings. Any opinions or estimates constitute the author’s best judgment as of the date of publication, and are subject to change without notice.

The Opportunity Keeps Getting Better

Summary

  • Investors are crowded into the same investment strategies, sectors, and individual equities, prodded & encouraged by central banks since the GFC.
  • Almost all investors are positioned for the same outcome, which is either an eventual recession, or the lower for longer narrative prevailing.
  • These anticipated certainties are why there are so many historic price dislocations today.

At the height of the prevailing bearishness in December of 2018, I was very bullish, writing privately for members of my research services, and publicly with articles such as, “Is Everyone Bearish“, and “2019 Is Going To Be A Banner Year For Value Equities“, which were both published on December 21st, 2018.

Looking back, this bullish stance was partially correct thus far, with the S&P 500 Index, as measured by the SPDR S&P 500 ETF (SPY), up 17.8% year-to-date in 2019 through April 29th, 2019, and targeted undervalued equities, like Chesapeake Energy (CHK), up 40% YTD in 2019, even after its recent pullback.

However, my bigger picture investment thesis, which has focused on the equities that are unloved, under-owned, and out-of-favor, articulated in articles like this one, “Everyone Owns The Same Stocks“, and with “Economic Growth Has Already Bottomed“, has only partially been embraced, as almost all investors expect either a recession over the next 2 years, or a continuation of the “lower for longer” narrative that currently has a python grip around the financial markets.

The surprise first quarter 2019 U.S. GDP reading of 3.2%, which came in far above consensus expectations, and the recent stronger economic data out of China, have done little to change the prevailing sentiment.

Put simply, almost everyone remains skeptical that any cyclical upturn in global growth expectations will have any staying power.

This sentiment, and the tendency of market participants to embrace what is working, has caused some historic price dislocations, such as the relative performance of commodities versus the S&P 500 Index.

Look at that chart above!

If you thought commodities were undervalued in the late 1990’s, the dislocation since 2011 has resulted in 100-year relative valuation levels being tested.

In summary, if you, like me, wish you could go back a decade ago in time(members of The Contrarian can read this last link), similar to Disneys’ (DIS) new Avenger’s movie, and buy the disruptive growth businesses like Amazon (AMZN), Apple (AAPL), Alphabet (GOOGL), Netflix (NFLX), even Microsoft (MSFT), and reap compounding returns that turned out to be hard to believe, I think a similar sized opportunity exists today. 

This time, from my perspective, the opportunity is in economically sensitive equities, some of which own tier 1, irreplaceable assets.

Sign Up For A Limited Opportunity

I am very excited about the year ahead, and I want to recruit as many members to my investment research services as possible.

To provide incentive, I have enabled a 20% price discount on memberships to The Contrarian, (founding members still have a lower price, but this is the lowest price offered in a long time) where we have a live history that actually captured the past significant inflection point in 2016.

I am also offering a very well received more traditional research newslettera stepping stone to The Contrarian, featuring direct email reports, with an introductory price of $250 for the first 10 subscribers that use the coupon code “half off”, which is 50% off the current annual rate, which will rise at the end of 2019. For access to that, sign up here.

Wrapping up, looking forward, instead of looking in the rear view mirror, is very important in life, and in the investment markets.

Disclosure: I am/we are long CHK, positions in the contrarian portfolios, and short spy as a market hedge.

Additional disclosure: Every investor’s situation is different. Positions can change at any time without warning. Please do your own due diligence and consult with your financial advisor, if you have one, before making any investment decisions. The author is not acting in an investment adviser capacity. The author’s opinions expressed herein address only select aspects of potential investment in securities of the companies mentioned and cannot be a substitute for comprehensive investment analysis. The author recommends that potential and existing investors conduct thorough investment research of their own, including detailed review of the companies’ SEC filings. Any opinions or estimates constitute the author’s best judgment as of the date of publication, and are subject to change without notice.

Dollar Divergence

  • The U.S. Dollar Index has rallied this year.
  • However, the Dollar Index has not made new highs on its recent rally.
  • Additionally, the Dollar Index remains materially below its 2015-2017 highs.  What does this mean?

The U.S. Dollar (UUP) has rallied in 2018.

However, if you look at the chart above, it is interesting that the U.S. Dollar Index has not made a new high this year, even with all of the recent tailwinds, including a sharp downturn in U.S. equities, shown by the SPDR S&P 500 ETF (SPY) below.

Additionally, looking at the bigger picture, the U.S. Dollar Index, even with its recent rally, remains substantially below its 2015-2017 highs, as the longer-term chart shows in the following frame.

Interesting, to say the least.

If the Dollar cannot make new 2018 highs with all the recent tailwinds, and remains materially below its 2015-2017 highs, what does that mean?

Is this a positive leading indicator for equities that would rally on Dollar weakness, including emerging market equities (EEM), developed international equities (EFA), international financials (EUFN), commodities, and commodity equities? 

Buy & Hold

(Travis’s Note: This post was originally written on March 8th, 2018, and I encourage readers to go to the original post to view the comments. The central theme of this article, which essentially boils down to buying-and-holding compounding equities, is a central theme of mine, from an investment philosophy standpoint.  Additionally, as part of the discussion, I talk about the “Punch Card Portfolio” in this post, and you will see multiple references to that in reading my research.  One last thing, the ground floor of the future sector that I think will thrive is commodity equities, specifically natural gas equities, and more specifically Appalachia natural gas producers, which members of WTKTheContrarian have already received one-deep dive report on Southwestern Energy (SWN), which I believe is the best-buy-and-hold stock in the U.S. market today, with more reports on these companies, and this sector, to be delivered in the future.)

  • Buying and holding quality stocks is a surefire path to investment success.
  • This is harder to do in practice than in theory.
  • Ground floor of a future sector that I believe will thrive.

Wednesday night, and Thursday morning, I worked on, and published, an article for members of The Contrarian that highlighted, what I believe, is one of the brightest future long-term growth opportunities in the United States.

As I was wrapping up this article, and the revisions to the article, it occurred to me, that the best way to participate in this sector is just to buy and hold a select group of companies for the foreseeable future.

Building on this narrative, we all look at the Dividend Champions or Dividend Aristocrats of today, and wish that we could have gone back in time and “bought in” on the ground floor of these company’s eventual successes, like eponymous Seeking Alpha author Buyandhold 2012, who is one of my favorite investors & commentators in SA’s community, and who many investors, including myself, at the tender age of 40, could learn from.

Aside from both being paper boys in our youth (do they even have paper routes for kids today?), our investment paths been very different, and I have learned (often the hard way) that buying and holding quality companies is the best way to get the most out of your investments.

In fact, the more I think about it, there is a compelling case that can be made for buying, and never selling, as this would make investors think about their investments in a different light, and ease the burden of what to do, and when to do it.

Buffett commented about this investment approach, and had a name for it, which he called the “Punch Card” Portfolio, meaning that if you had a punch card, and could only make 20 investments in your life, and that was it, it would make most investors better investors.

Think about that for a minute, as I am sure almost all of us as investors would have run through our 20 “Punches”, as the electronic world of investing is conducive to over trading, and over analysis.

I wrote about the “Punch Card” Portfolio, and John Hempton’s take on this type of Portfolio in an October 20th, 2016 article for members.  If you are a member of The Contrarian, click on the above link, and it will take you to this article.

Looking back, most of my biggest investment mistakes in life have involved selling companies too early, as there is no limit to how much a quality company can compound wealth, given time.

The problem today, is that almost everything is overpriced, including many of the stalwart companies in the in S&P 500 Index (SPY), and many of the Dow Jones Industrial (DIA) components, so it is hard to find a quality company that is attractively priced.

This leaves an investor with two primary choices, including building cash to wait for future opportunities, and spending time looking for undervalued companies in out-of-favor sectors.

Instead of purchasing the broader stock market at all-time valuation highs, would it not be much better to buy a sector, or a group of companies, that was selling at multi-decade lows in terms of valuations?

Do these type of companies even exist in today’s hyper valued stock market?

Said another way, are there any “Punch Card” investment opportunities today?

The answer is a resounding yes.

To find them, though, as an investor, you have to look forward, not backward, and this is hard to do too, as almost all of us want to extrapolate the past into the future.

This is human nature, and it causes us to miss opportunities as the investment markets are non-linear in structure.

What if I said that there is a group of companies as undervalued as the best opportunities at 2009’s market bottom hiding in plain sight, with the wind at their back for the foreseeable future?

Clearly this does not describe the broader stock market today, but there are a group of company’s, much like REITs, or small-cap equities in 2000, that are extremely out-of-favor, while the market is extremely in-favor.

Would it help to know that these companies are profitable today, even at the bottom of a nearly decade long bear market in their industry, and just beginning to pay dividends and return cash flow to shareholders?

Would it help to know that these companies own emerging Tier 1 assets in a world that has largely already been discovered and owned?

Over the next several months, I am going to write several public articles on these companies to get commentary and feedback from fellow investors.

For now though, particularly over the next several weeks, I am going to double my efforts for members of The Contrarian, as after a lot of blood, sweat, and tears, I am increasingly coming to the realization that a huge opportunity is right in front of us as investors.

To read my recent article and get a preview of what I think could be long-term quality companies early in their life-cycle, in an emerging out-of-favor sector, consider taking a two-week free trial to “The Contrarian“.

If it is not for you, there are no hurt feelings.

I am willing to face rejections, as I try to put together a unique group of investors, traders, and speculators.

In fact, we would welcome a few qualified dissenters to the group to take the other side of the thesis, and to flush out these investment ideas further, so if that could be your role, send me a message and I will respond.

Best of luck to everybody, and have an enjoyable end to the week,

WTK

P.S. If you have a “Punch Card” stock idea today, meaning a stock that you would buy and hold forever, share it in the comments section, and we could probably get a good discussion going.

Disclosure: I am/we are short SPY In A Hedged Portfolio..

Additional disclosure: Every investor’s situation is different. Positions can change at any time without warning. Please do your own due diligence and consult with your financial advisor, if you have one, before making any investment decisions. The author is not acting in an investment adviser capacity. The author’s opinions expressed herein address only select aspects of potential investment in securities of the companies mentioned and cannot be a substitute for comprehensive investment analysis. The author recommends that potential and existing investors conduct thorough investment research of their own, including detailed review of the companies’ SEC filings. Any opinions or estimates constitute the author’s best judgment as of the date of publication, and are subject to change without notice.

The Wrong Signal

Brief Intro Note From Travis

While the Fed has 5-6 more interest rate hikes projected to get back to the projected neutral Fed Funds Rate according to the Fed’s Dot Plot, which is at the low end of historical neutral rates, the financial market is going to force the Fed to pause in their rate hiking campaign.

How?

The Fed is not going to invert the yield curve, and the market is going to force the Fed’s hand, providing a tailwind for an unexpected market development, which is the return of sustained inflationary pressures.

Thesis

The Fed will not invert the yield curve intentionally, and this reluctance will cause the Fed to settle at a lower Fed Funds Rate, at least temporarily, providing a continuation of historically accommodative monetary policy.

Setting The Stage – The Market Is Going To Force The Fed’s Hand

Right now, the market is pricing in a 99% chance of the Fed raising the Fed Funds Rate from a range of 1.75%-2.0% to 2%-2.25% at their September 2018 meeting.

Additionally, the financial markets are pricing in a 67% chance that the Fed will raise the Fed Funds Rate an additional quarter point at their December 2018 meeting to a range of 2.25%-2.50%.

So far, so good, according to market expectations.

However, looking out a year from now to September of 2019, there is only a 37% chance, according to the financial markets, that the Fed will raise rates one more time to the 2.50%-2.75% Fed Funds Rate target range.

Additionally, looking at the table above, there is a higher percentage chance, according to the financial markets, that the Fed will not raise rates one single time from December of 2018 all the way through September of 2019, versus the Fed raising rates twice.

Building on the narrative even further, the financial markets are pricing in a higher probability of a cut in the Fed Funds Rate in 2019, after the December 2018 Fed Funds Rate increase, than three Fed Funds rate hikes in 2019.

Market Expectations Do Not Square With The Dot Plot

While the financial markets are current predicting three more rate hikes in total through September of 2019, the Fed’s most recent Dot Plot showed four rate hikes in 2018 (two more to go) and an additional three rate hikes in 2019.

Clearly the market is much more pessimistic than the Fed’s own projections for their path of interest rates.

Why is this the case?

Yield Curve On The Cusp Of Inverting

The answer as to why the market’s expectations of future interest rates is more pessimistic than the Fed’s can be found in the yield curve.

Specifically, in the United States, 2-Year Treasury Yields have kept on rising, and remain near their recent highs.

However, 10-Year U.S. Treasury Yields have retreated from their recent highs, as the fears of higher long-term interest rates that were prevalent near the beginning of 2018, have receded.

With 2-Year Treasury Yields continuing to rise, and 10-Year Treasury Yields retreating, the yield curve has flattened significantly.

Putting it all together, market participants almost all know that an inverted yield curve has been a marker for a future recession, with a lead time of roughly 18 months.

Thus, we are in an investment landscape where most investors and speculators are casting a wary eye to the future, believing a recession is around the corner.

The Wrong Signal

The yield curve is flattening, and most investors and speculators are trying to make sense of this development.

This price action has obscured something remarkable.

Specifically, under a rules based approach, the Fed Funds Rate should be much higher.

More specifically, under the Taylor Rule, which is shown in the blue line in the above graph versus the actual Fed Funds Rate in depicted by the red line, the Fed Funds Rate under a rules based approach is targeted at 7.5%.

Before dismissing this analysis reflexively because of the level of the forecast, look how closely the Taylor Rule implied Fed Funds Rate tracked the actual Fed Funds Rate from 1980-2000.

Why is the Taylor Rule suggesting such a high Fed Funds Rate?

Two answers come to mind.

First, even though the current economic recovery dating to June of 2009 (for reference the U.S. stock market actually bottomed in March of 2009) has been anemic, averaging 2.2% Real GDP Growth, which is the second-worst growth rate for an economic expansion in the post-WWII era, the extraordinary length of the expansion has provided a cumulative economic growth that is greater than most market pundits, including myself, give the market credit for, and this cumulative growth has started to register on capacity restrained barometers.

Second, economic growth has picked up noticeably with the initial readings for Q2 2018 U.S. Real GDP Growth posting a 4.1% growth rate, noticeably above the Real GDP Growth Rate in this expansion.

Adding to the narrative, Real GDP Growth is picking up further, with the Atlanta Fed GDP Now Model back up a 4.6% Q3 2018 Real GDP Growth rate reading.

For all its criticisms, the Atlanta Fed GDP Now Model has been more accurate than the Blue Chip economists consensus forecast over the past six months, as the Atlanta Fed GDP Now Model, does not have the biases that human forecasters do, including myself, so if there as truly been a change in the growth paradigm, an unbiased model is likely to capture this change earlier.

Takeaway – Market Is Mispriced

The bond market, stock market, and commodities market are priced for pessimistic growth right now.

The Fed Funds Rate futures market does not even believe the Fed’s own forecasts right now about future interest rates or economic growth.

Historically, where the Fed has been more wrong than right with their forecasts, particularly at inflection points, we can understand the market’s hesitation.

Wait, but isn’t the U.S. stock market at record levels?

Yes.

However, the U.S. stock market has become a “safety trade” for global capital flows over the past decade.

Thus, stock markets outside the U.S. are painting a different picture of performance.

Additionally, below the surface of the U.S. stock market, economically sensitive equities, including many of our favorite targeted equities right now, have had abysmal relative, and absolute, performance over the past decade.

Why?

Economic growth has been disappointing in the United States, relative to past economic expansions over the past decade, and economic growth globally has been disappointing relative to expectations.

However, what if economic growth has finally reached a cumulative level of expansion after roughly a decade of GDP growth, that we are on the verge of triggering a traditional late-stage capital rotation?

Summarizing, for someone who nailed the potentially secular turning points in bonds and commodities in 2016, and who was rewarded for it handsomely, the last twenty months have been more difficult that almost any investing environment I have been through over the past 25 years, as there simply has not been uptake, or follow-through with regard to economically sensitive equities, particularly those value-oriented equities that should benefit the most from a turning point in economic growth expectations

The upside today is trades are more crowded than even 2016, as almost everyone believes in a uniform outcome in the financial markets, yet what if we are finally at the destination, after a very long journey, that demand is outstripping supply on a sustainable basis, and what if economic growth is actually accelerating, not rolling over?

Is the possibility of this scenario even priced in by the markets?

Even if the more modest projections of the Fed are more accurate than the markets current projections, what asset classes would benefit?

The more I think about it, the stage is set for the shunned equities of the past decade, notably commodity equities, international equities, and emerging market equities, to excel going forward.

The curve-ball of July and August of 2018, when liquidity conditions were supposed to permit a rally in risk assets, yet the safe-haven assets outperformed even further, was one of the market’s financial acts of deception, from my vantage point, eschewing investors from the very trades that are set to thrive.

To close, ironically the market is setting up a scenario where the market constrains the Fed, causing the Fed, at a minimum, to pause in their interest rate hikes, and more likely causing the Fed to settle at a terminal Fed Funds Rate in this this rate hiking cycle that is much easier, in-terms of monetary policy accommodation, that past Fed Funds neutral rates.

With the market potentially constraining the Fed, forcing an easier than normal monetary policy, the odds of higher economic growth actually increase, which would further benefit the downtrodden economically sensitive equities and inflation sensitive equities, both of which have been cast aside.

Interested to see if we can get a good discussion going on this,

Travis

Going To Bed Thinking About The Fed

Introduction Note From Travis

We have had a good discussion in The Contrarian lately regarding the Fed, specifically their pace of interest rate increases, and how close we are to the end of the current market cycle.

This has got me thinking, researching, and discussing, the end-game to this cycle over the past several days, and I wanted to put these thoughts on the proverbial paper.

Ultimately, I believe the Fed is behind the cycle, and the late-stage cycle investments are only at the beginning of their rally, with the first leg higher in these assets occurring in 2016, and the next leg higher set to commence, perhaps imminently.

Thesis

The Federal Reserve and the rest of the world’s central banks fear deflation, as 2007-2009 is still planted firmly in their minds, and thus monetary policy has stayed looser for longer, and will continue to do so, resulting in elongated investment cycles and a long runway for inflationary assets.

Fed Is Behind The Curve

On March 16th, 2017, I published an article for members of The Contrarian titled, “Market Historian – What Happens When The Fed Hikes Rates“, examining what happens to the markets in Fed tightening cycles.

Midway through the article, which looking back was very prescient (and I wish I would have followed my own rationale, reasoning, and logic better in 2017), I talked about the Taylor Rule, and posted a chart showing the differential in the Fed Funds Rate, and what the Fed Funds Rate would be projected to be under the Taylor Rule.

Back in March of 2017, the gap between the actual Fed Funds Rate and the Fed Funds Rate predicted by the Taylor Rule was pretty large, around 4%.

As economic growth in the United States has accelerated, and Fed Fund Rate increases have lagged past rate hiking cycles, that differential gap has widened further today.


With the Effective Federal Funds Rate hovering around 2%, and the Taylor Rule projecting the Federal Funds Rate should be 7.5% today (read that again and think about it) the gap between the projected Fed Funds Rate by the Taylor Rule, and the actual Fed Funds Rate has widened to 5.5%.

In summary, even though the Fed has accelerated their pace of tightening in 2018, they have actually allowed monetary policy to become looser relative to economic growth, and this easy monetary policy environment has the potential to spark an inflationary boom, which would be the best possible environment for inflationary equities, specifically commodity equities.

2004-2006 Tightening Cycle As A Comparison

The Fed has been predisposed to easier monetary policy for a long time.  The graph above would date this predisposition to around 1990, and as a market historian, I would say it began earlier, really with Fed Chairman Greenspan, particularly following the October 1987 U.S. stock market crash, where the Fed began easing interest rates immediately, after tightening them from February of 1987.

After the 2000-2002 U.S. stock market downturn, the Federal Reserve was noticeably slower to raise interest rates, waiting all the way until June of 2004 to lift rates from the 1% bottom.

Remember, 2003 was a very strong year for risk assets, so the Fed waited the entirety of 2003 and into 2004, and then they began raising rates at a steady pace.

How steady?

As I wrote in the member Market Historian article, the Fed raised rates 17 times from June of 2004 to June of 2006, which was a much faster rate hike cycle than we have seen in the current economic expansion and equity bull market.

Interestingly, the Fed stopped tightening in June of 2006, about a year-and-a-quarter before the U.S. stock market, as measured by the SPDR S&P 500 ETF (SPY), peaked late in 2007.

Adding to the narrative, commodity prices increased during the Fed tightening cycle in June of 2004 to June of 2006, adding to their advances from 2001 through June of 2004.

The price action of commodities in the chart above from 2004-2008 is of particular interest today, as I believe we are on the same path with regards to the economic cycle and financial markets today as were were back then.

Specifically, index funds dominated fund flows from 2003-2007, in a prelude to what we have seen during the current bull market, and volatility was muted, before an unwind.

It is my personal belief that the current U.S. equity bull market is sort of a hybrid between the 1990-2000 U.S. equity bull market, with growth assets dominating as I wrote about recently for members, and the 2003-2007 U.S. equity bull market, when passive flows became the go to investment vehicle for institutions on the traditional equity side.

Cycles Are Extended

With the Federal Reserve, and the world’s central banks sticking with a policy of negative real interest rates for longer than ever before, I believe investment cycles have lengthened.

From the Martin Pring graphic above, I think bonds have topped, with sovereign bonds making their secular highs (lows in yields) in 2016, so we are somewhere between Stage 4 and perhaps at the early part of Stage 5.

Keep in mind, the 4-5 year time-frame in the graphic above applied to U.S. markets historically, so again, I think investment cycles, especially on a global basis, have been elongated, so each stage of the cycle could be running 2x to 3x what is shown above.

For that reason, the current investment landscape, with large-cap growth outperforming has seemingly persisted forever.

This is the bad news.

The good news is that the other stages should be elongated too, so there should be an even longer runway for our favored late-stage asset plays today.

Investment Implications

The first thought that comes to mine is to buy iShares 20+Year Treasury Bond ETF (TLT) puts.

Why?

1.  The Fed is clearly way behind in their interest rate hiking cycle, and adding to this narrative, they may stop at a terminal rate that is significantly below what could be called for in a higher growth/higher inflation landscape.

2.  Sovereign interest rates have clearly bottomed in 2016, yet there is a reluctance to embrace this right now, and with 2007-2009 still fresh in most investor’s minds, the natural inclination is to buy bonds for a safety trade.

The second thought is that commodity equities, which have dominated the Top-Ten List, should be primed for their second leg higher.

The SPDR S&P Oil & Gas Exploration & Production ETF (XOP), which is already in the midst of its second leg higher, with the first leg occurring from the Spring of 2016 through the end of 2016, followed by a difficult pull-back for the majority of 2017, before embarking on the beginning of its second leg higher in the depths of despair in 2017, is a good leading indicator for the rest of the commodity complex today, in my opinion.

Thus, if XOP continues its uptrend of higher highs and higher lows, I think this will be a good sign for commodity equities in general, a few of which I have identified as particularly juicy opportunities, at least from my vantage point, in a recent member post titled Volatility Creating Opportunity.

The third thought that is on my mind is that the current equity bull market could go on longer than expected, as the late-stage cycle investments, have not really even gotten underway in what should be a longer than normal time-frame for late-stage cycle assets.

Having said that, projected real returns for the broader stock and bond markets are beyond abysmal today.

In summary, there really are only select pockets of value, and commodity equities are one of the sweet spots in my opinion.

Takeaway – Long Runway Still For Late Stage Assets

The Fed is farther behind in their rate hiking cycle than every before, and their glacial pace of interest rate increases in the current almost decade long equity bull market is a prime factor behind the price dislocations that we are seeing today.

Imagine for a second that monetary policy was normalized from 2009-2012.

Would we have the excesses and the imbalances that we have today?

Probably not.

However, you have to play the hand you are dealt.

Building on that narrative, the dislocations and dispersion in the financial markets the past decade is creating a Golden Age for active investors, as the supply/demand dynamics of many economically sensitive industries have been stretched to extremes, highlighting the importance of the capital cycle, and providing what I think are the investment opportunities of a lifetime.

Looking forward to what should be a dynamic rest of 2018,

Travis

Turning Points Take Significant Time

  • Inflection points develop slowing, building like a kindling fire, before the flames erupt.
  • Similar to a big ship, broad market inflection points take significant time.
  • Price action continues to suggest that a major turning point is at hand, however, this has not been confirmed yet.

Intro Note From WTK

We have had two major inflection points in the broader markets in the past 20 years.  Specifically 1999-2003, and 2007-2010.  These years spanned dynamic changes in investment prices, with overvalued investments plunging while undervalued securities found a bid in both scenarios, and these selected years framed time spans where asset allocation and security selection really mattered.  Right now, I think we are in the midst of our third major inflection point in the last 20 years.

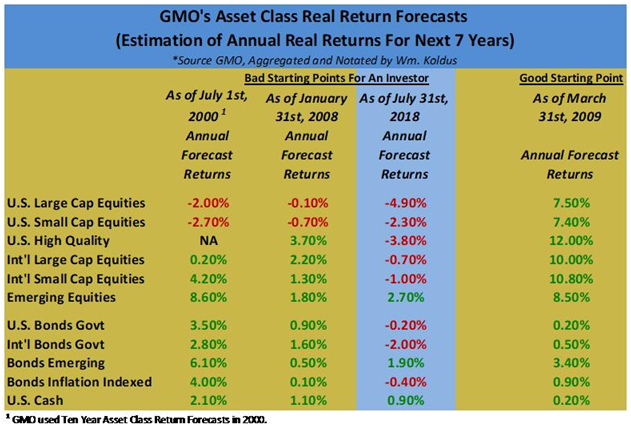
Building on this narrative, prospective future real returns for developed market equities, specifically U.S. stocks and U.S. bonds, look more dire today than they did at the beginning of 2000 or 2008.

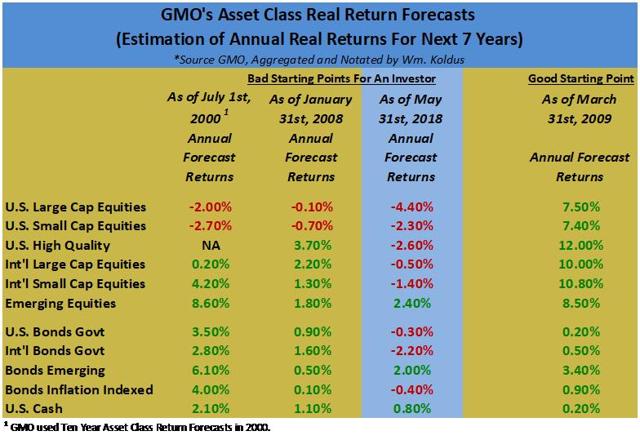
We can go back, with the benefit of hindsight, and make fun of, or objectively criticize firms like GMO all we want for their prior real return forecasts, however doing that (the criticizing) ignores that their forecasts, and others with a valuation bent, are based on an underlying valuation methodology, and valuation still matters in the end.

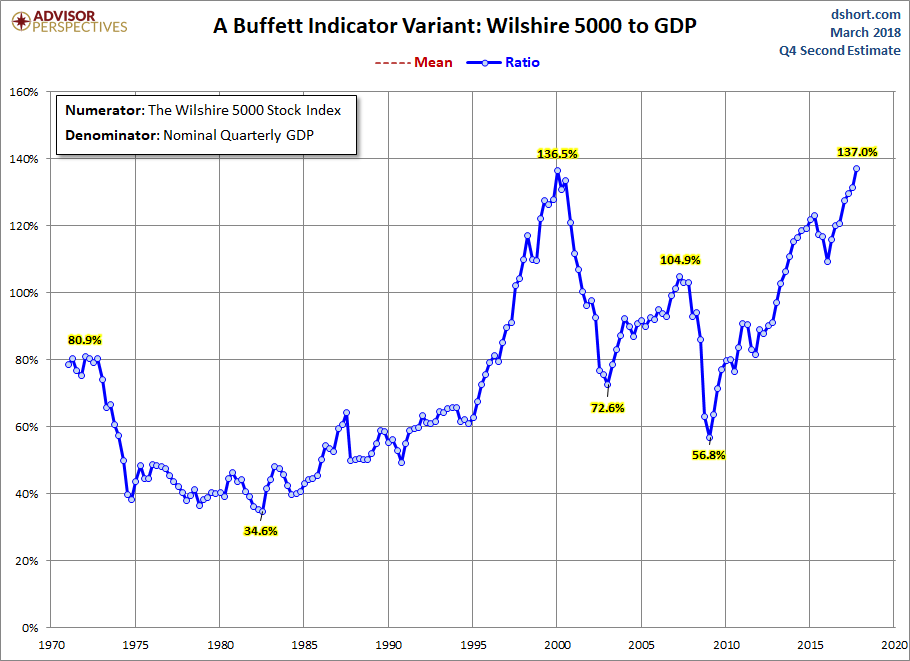
Put simply, starting from one of the highest starting points in market history in terms of valuations, adjusted for record profit margins, means that an investor today in U.S. stocks and U.S. bonds has very little probability of generating healthy future returns, until the starting point is more favorable.  Going further, generating positive real returns over the next decade in the broader U.S. equity market may be a bigger challenge than many investors realize.

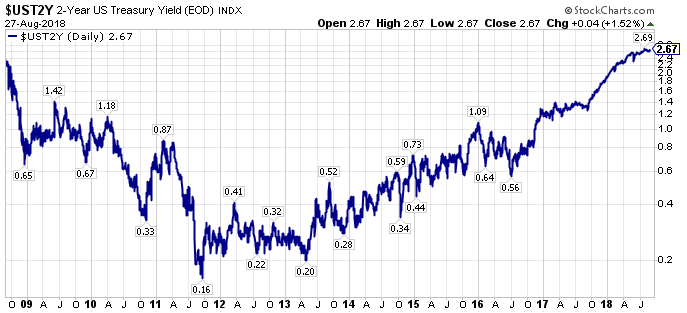
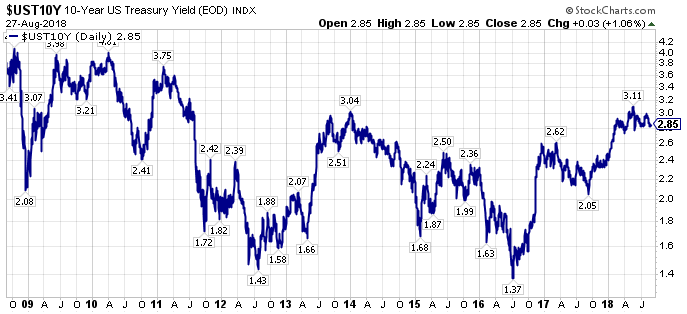
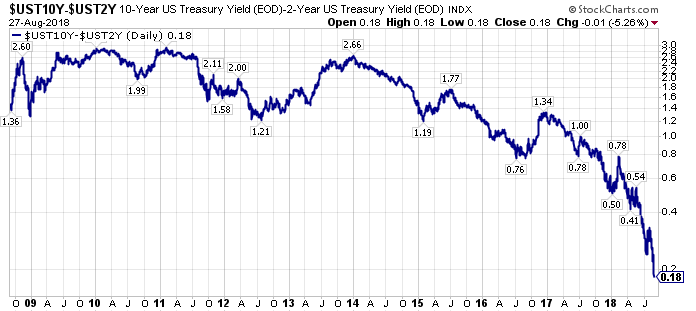
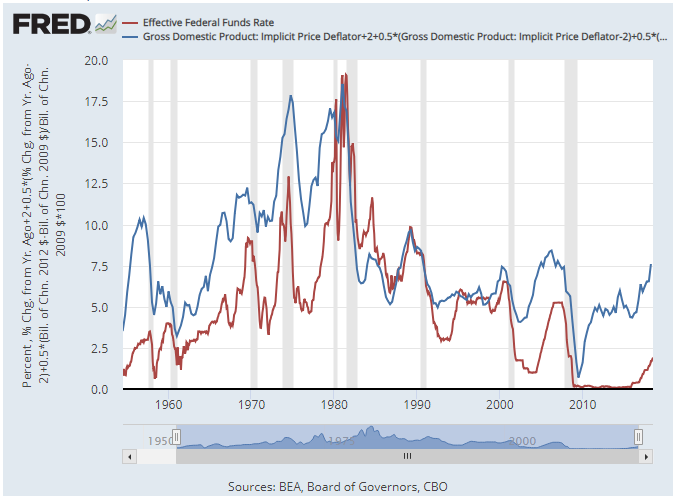
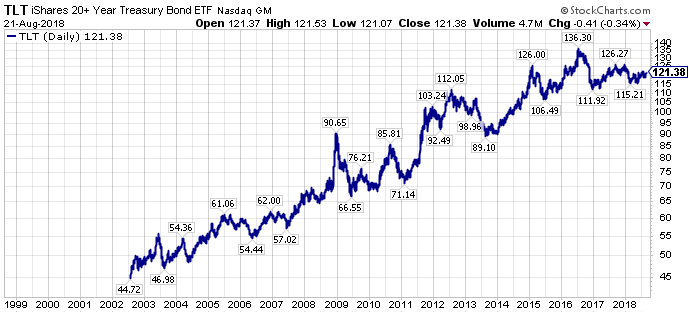
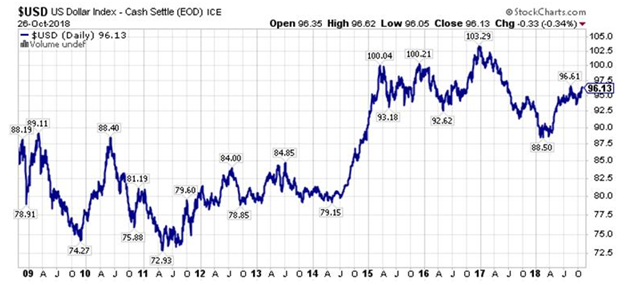
Adding to the narrative, it appears that we are in the midst of a secular turning point in bonds, as I have written about in-depth in my member Eye On The Bond Market series where the 35 plus year bond bull market is sovereign bonds came to an end in 2016.

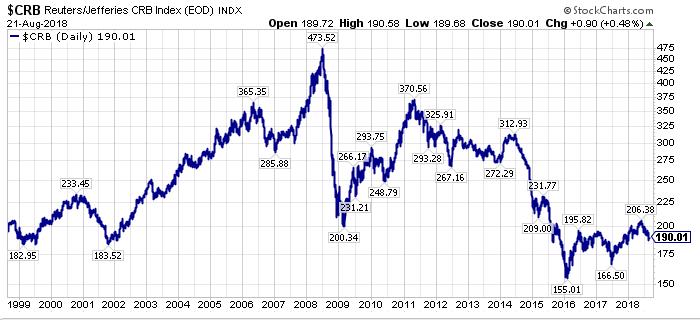
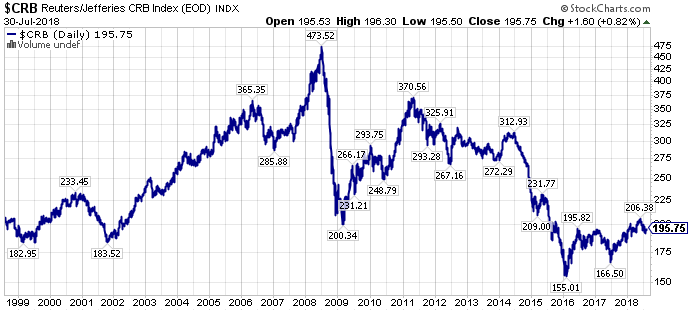
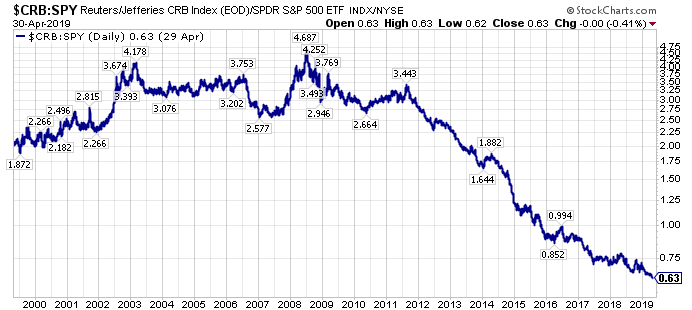
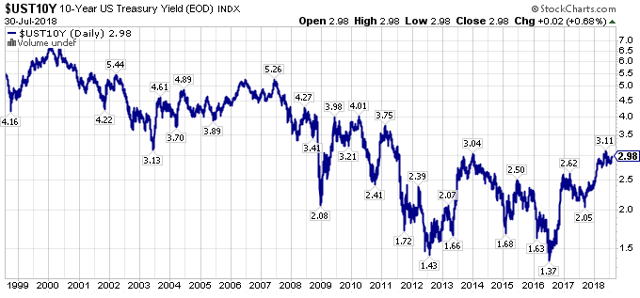
The bottom in bonds, which occurred in the middle of 2016, occurred after a bottom in commodity prices, which occurred near the beginning of 2016.

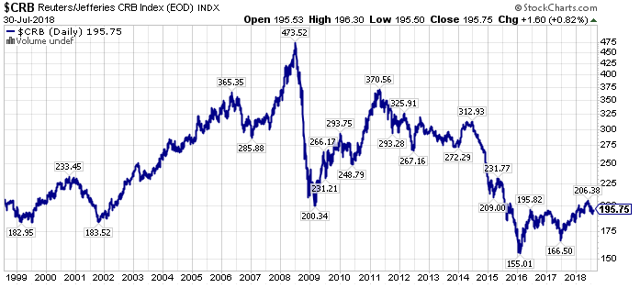
So far, the potential 2016 secular bottoms in commodity prices and sovereign bonds are acknowledged, however, they are not widely embraced, as there remains a lot of skepticism and pessimism among investors and speculators.

This pessimism and skepticism is prevalent, in part, because the market leaders during the length of the current bull market have remained in-favor, with notable strength in the FAANG and large-cap growth equities this year.

Building on this narrative, large-cap growth stocks are at the tail-end of a decade long run, so it would not be surprising for the top in the large-cap growth leaders to coincide with the top of the current equity bull market.

With bonds topping, equities are on the clock to top next, though given the dynamics of the current global business cycle, the topping process could be elongated to an extreme degree, a potential extension (on steroids) of the 2000 topping process.

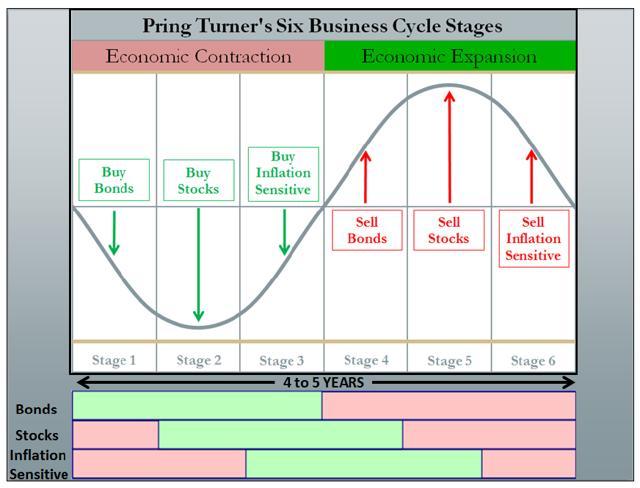
Wrapping up this introduction, we should be in the sweet spot for inflation sensitive assets to outperform, and that has indeed been the case since January of 2016, yet right now, market leadership remains a clouded picture, so a majority of investors and speculators have not yet adapted to the new investing landscape.

In my opinion, that capital rotation recognition point is coming, and when it arrives, we should see even stronger price moves than we saw in the historic reversal and rebound in 2016.

FAANG & Large-Cap Technology Leadership – Beginning Of The End

Price action in the markets was interesting at the end of last week (when I started to write this article…I am now finishing it up Monday evening), and this interesting price action continued today.  Could we be at the beginning of a long awaited capital rotation?  Only time will tell.

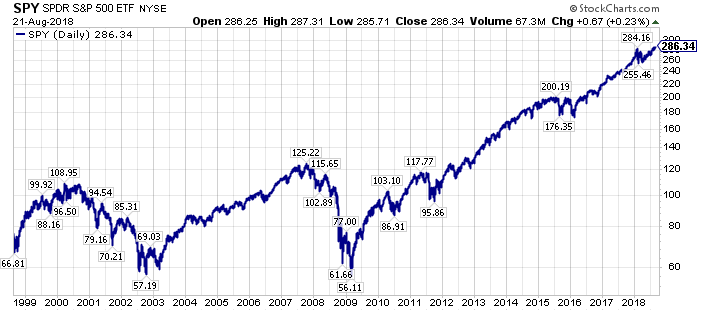
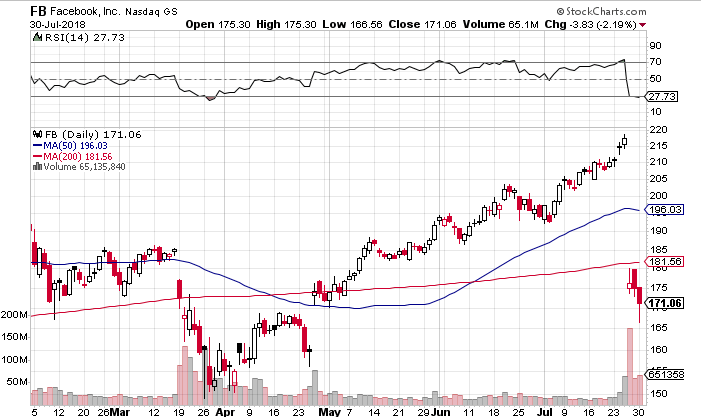
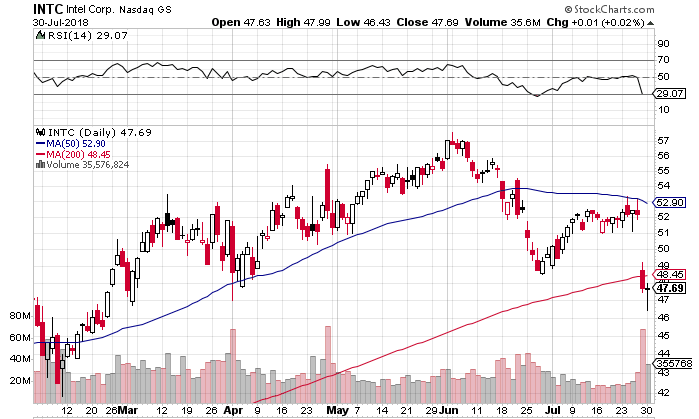
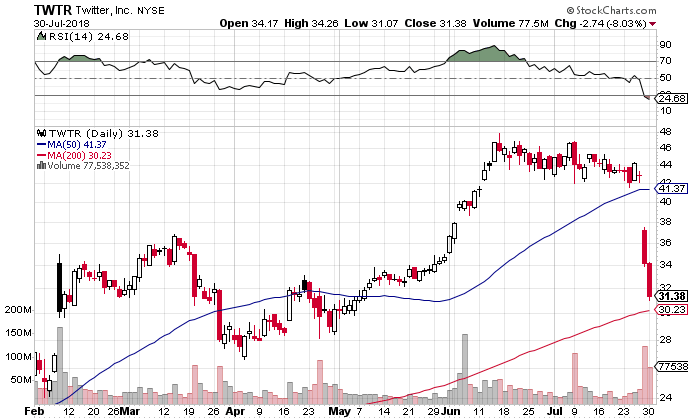
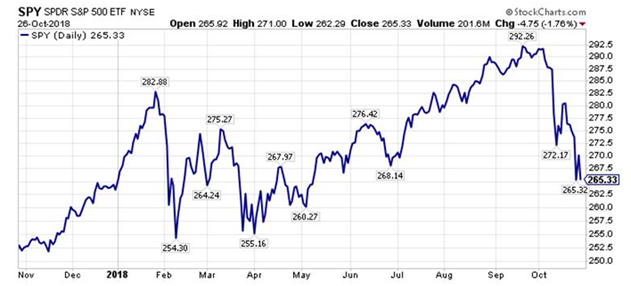
Last week, the S&P 500 Index (SPY), registered its 4th straight week of gains, but market leading stocks like Facebook (FB), Intel (INTC), Netflix (NFLX), and Twitter (TWTR) showed cracks in their armor.

The selling pressure in the large-cap technology leaders escalated today, Monday, July 30th, as the following charts show.

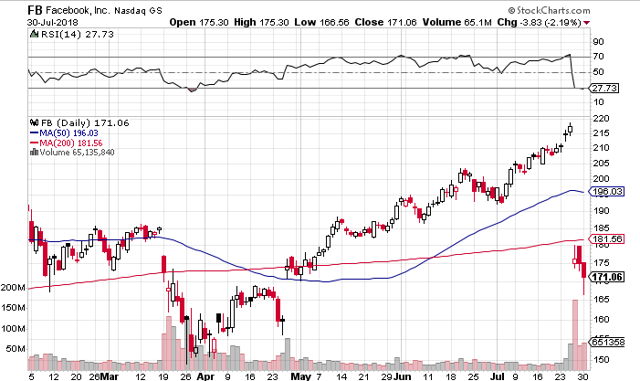
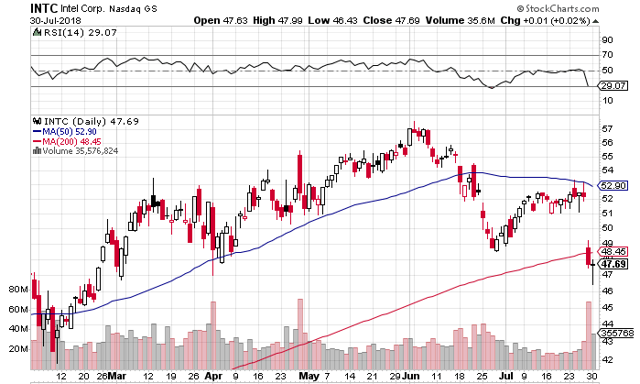
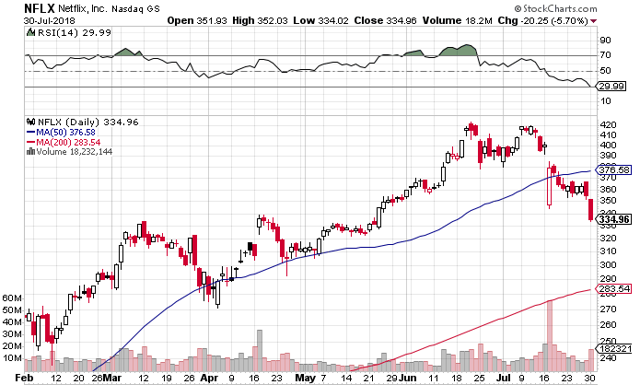
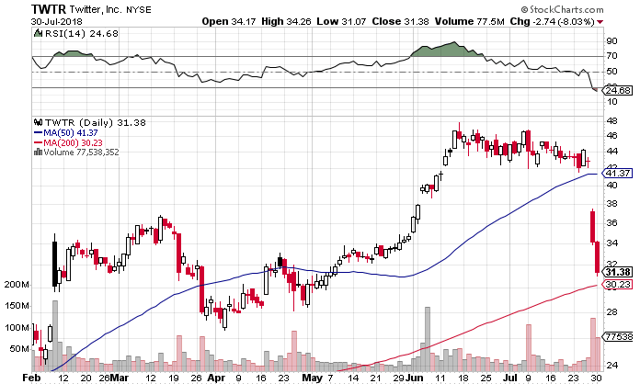
Year-to-date in 2018, FB is now down -3.1%, Intel is higher by 4.6%, Netflix is higher by a still remarkable 74.5% in 2018 (NFLX was higher by roughly 120% at one point), and TWTR is up by 30.7% YTD in 2018, after being higher by over 90% at its 2018 highs.

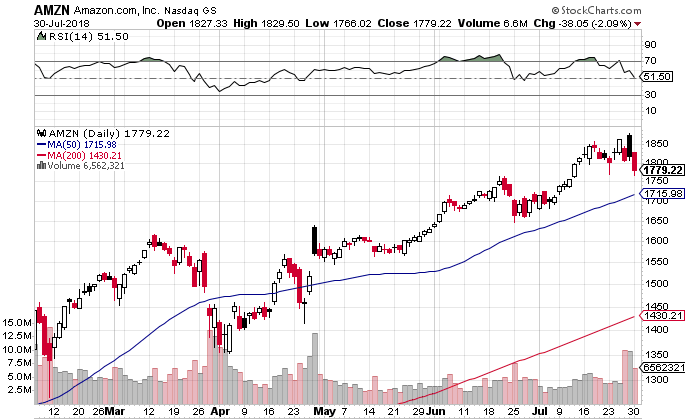
Three stocks have accounted for a substantial majority of the S&P 500’s 5.8% 2018 gain through Monday’s close.

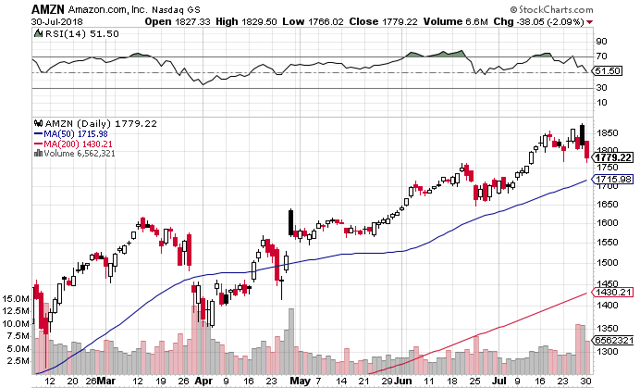
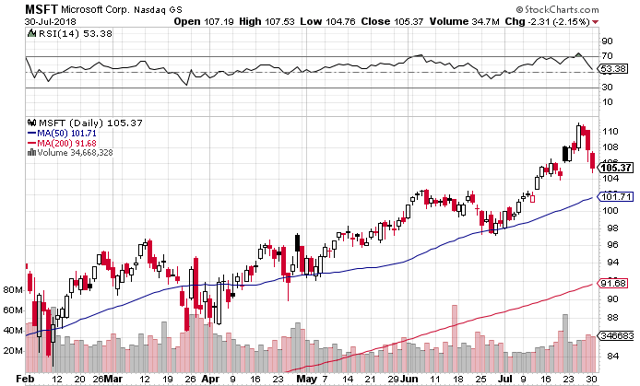
These stocks are Amazon (AMZN), Microsoft (MSFT), and the aforementioned NFLX.  AMZN’s shares are up 52.1% YTD through Monday’s close, and MSFT’s shares are higher by 24.3%.

AMZN and MSFT shares both remain in strong up-trends, thought the recent weakness in the NASDAQ, and in large-cap technology stocks, has hurt the relative strength of both equities.

Ultimately, the Invesco QQQ Trust (QQQ) is still higher in 2018 by 12.9% as of this writing, down from its earlier 18% gains, yet still higher than the comparative return of the S&P 500 Index (up 5.8%) or the Dow Jones Industrial Average (DIA), which is up 3.4% in 2018 YTD.

Will 2018 resemble the technology peak of 2000?

There are certainly similarities, with loved market leaders that couldn’t possibly decline substantially (could they?), and a decade of growth out-performance in the rear view mirror.

Commodity Stocks Still The Intermediate-Term Leaders

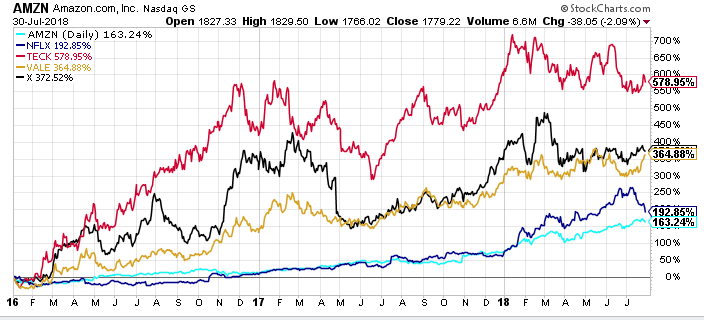
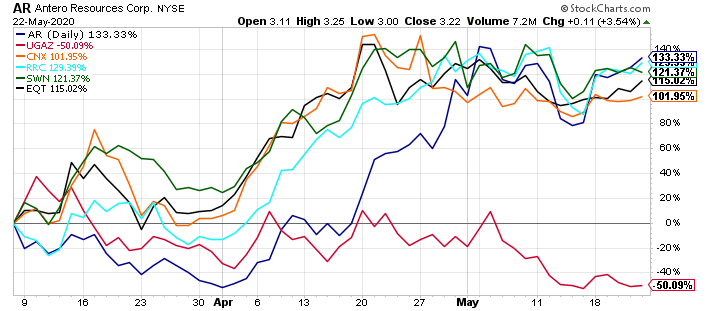
As strong as FAANG equities, particularly Amazon and Netflix have been, they still trail the best performing commodity equities since the start of 2016, as the following chart illustrates.

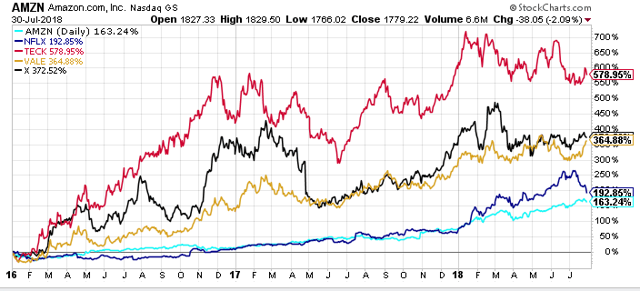
Stocks like Teck Resources Limited (TECK), which is Canada’s largest natural resource company, Vale (VALE), and U.S. Steel (X), have outpaced the performance of AMZN, and NFLX shares by a wide margin, which is saying something.

Now, not all commodity equities are up to the same degree, and some energy equities are even lower, however, this is a opportunity, in my opinion, as commodities, and commodity equities are the broader market’s performance leaders since the start of 2016.

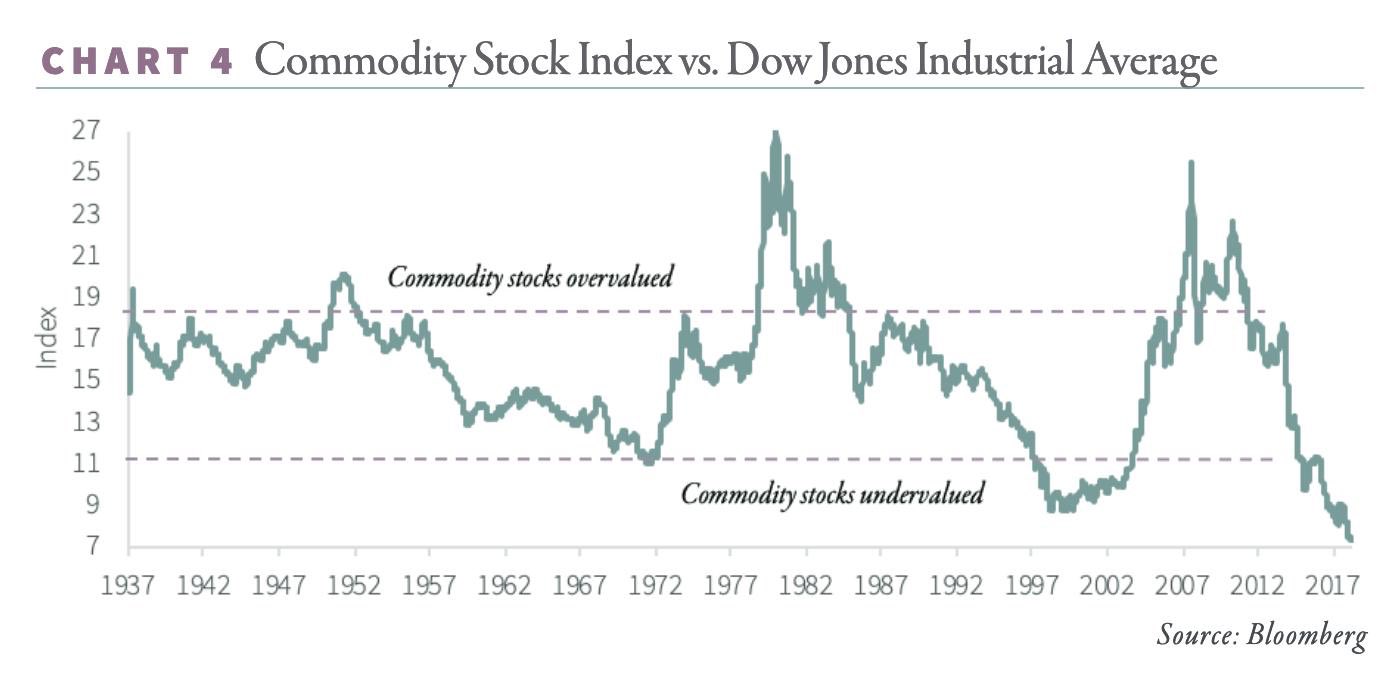
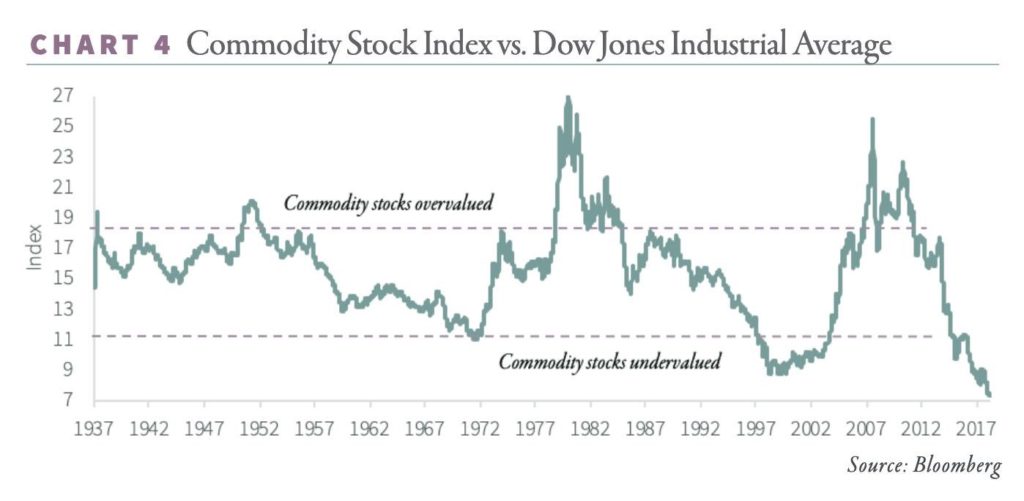
The Takeaway – Commodity Stocks Remain Insanely Cheap On A Relative & Absolute Basis

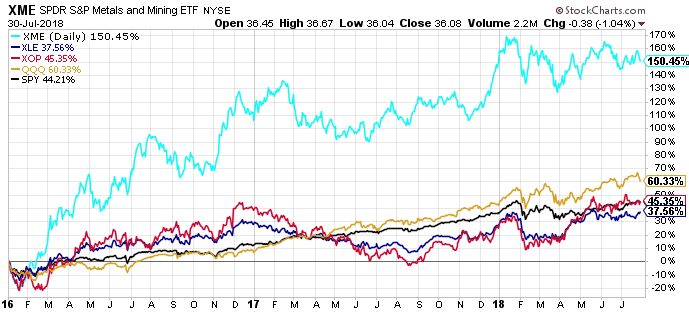
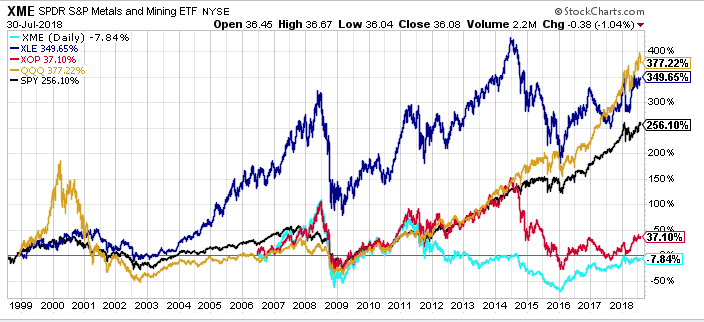
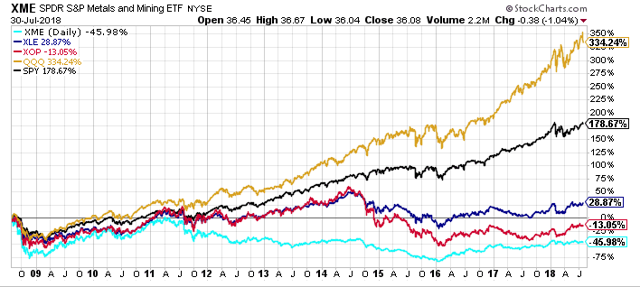
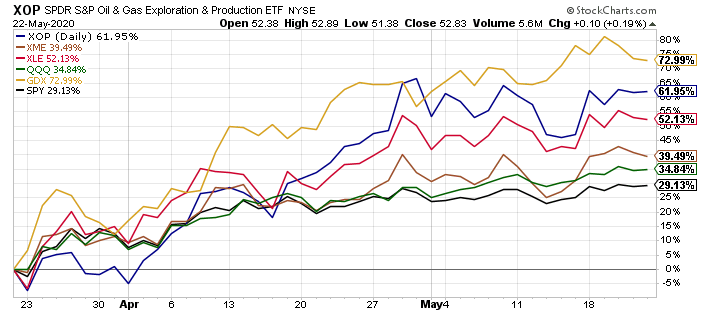
Despite the secular bottom in commodities, commodity equities, and sovereign interest rates in 2016, and the out-performance of commodity equities, particularly base metal stocks, as shown by TECK, VALE, and X earlier, and also by the SPDR S&P Metals and Mining ETF (XME), illustrated in the first chart below, since the start of 2016, commodity equities have struggled in the bigger picture.

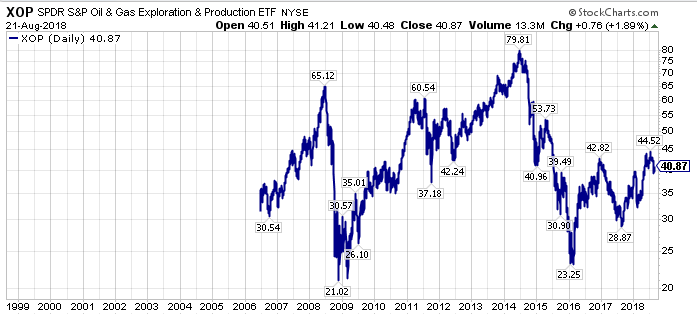
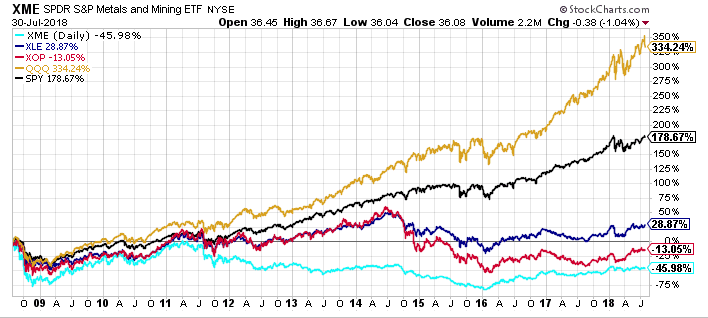
Looking back over the past 10 years, the performance of XME, the Energy Select Sector SPDR Fund (XLE), and the SPDR S&P Oil & Gas Exploration & Production ETF (XOP), which have returned 28.9%, -13.1%, and -46.0% respectively, have dramatically trailed the performance of SPY and QQQ, which have delivered total returns of 178.7%, and 334.2% respectively.

Widening the lens even further to 20 years, reveals something even more interesting.

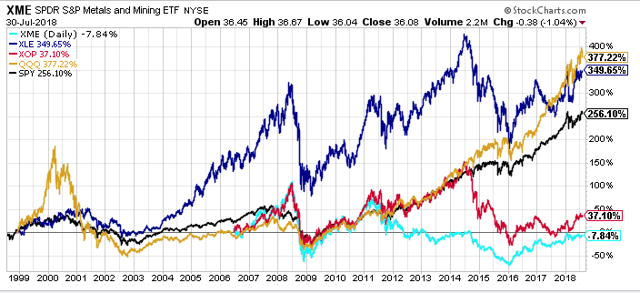
Specifically, the large-cap energy equities represented by XLE, think the Exxon’s (XOM) and Chevron’s (CVX) of the energy space, have kept pace with the QQQ, as XLE has returned 349.7% over the last 20 years, slightly trailing QQQ’s total return of 377.2%.  Both have outpaced the S&P 500 Index, which has returned a not too shabby 256.1% total return over the last 20 years.

Thus, large-cap energy equities have excelled, while their smaller capitalization brethren, as represented by XOP, have struggled mightily, though the small-cap energy equities have outperformed the base metal and mining equities of the XME.

Looking at the performance data, there is a clear value delineation, ordered by market capitalization in the commodity equity universe.

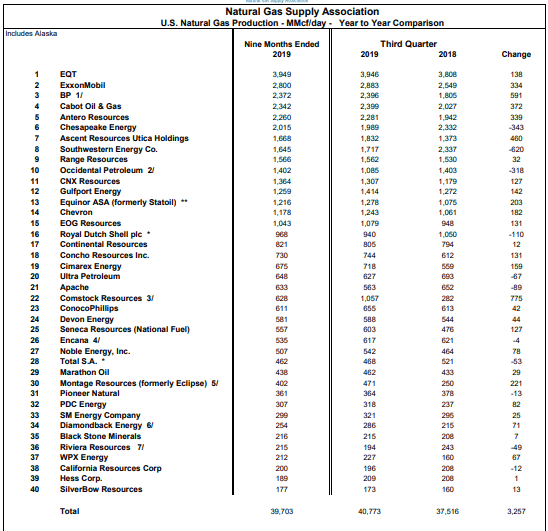
This is why a stock like Southwestern Energy (SWN), which remains a top-five U.S. natural gas producer (and one of the most undervalued equities in the market today IMO), yet SWN has clearly been part of the Have Not group of equities, as evidenced by its market capitalization, or Cleveland-Cliffs (CLF), which I also believe remains very cheap on a relative and absolute basis, yet CLF shares remain extremely out-of-favor, remain so attractive.

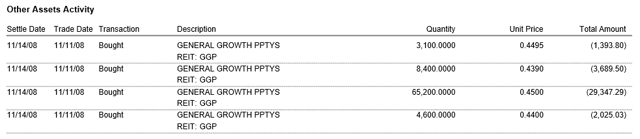
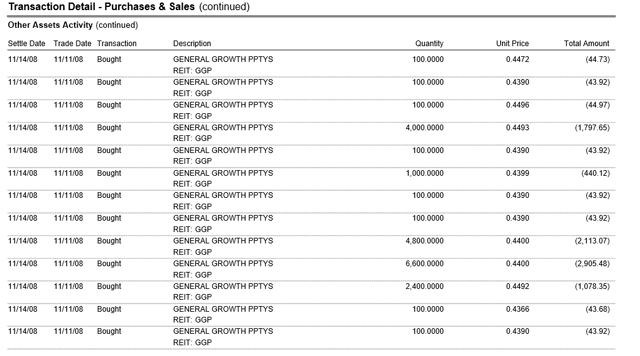
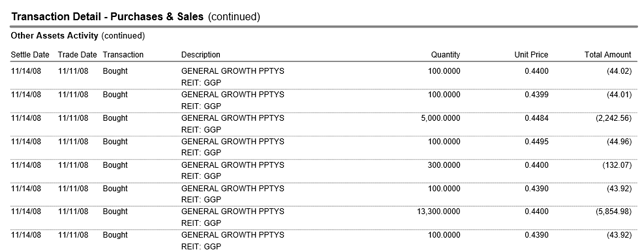
These are the quintessential value stocks of today, the proverbial REITs of the late 1990’s.

It is easy to forget now, but entering the year 2000, technology stocks had ruled for the prior decade, and they started the year strongly.

Does that sound like the past decade to you?

It should.

What happened next.  Well technology stocks topped in March of 2000, and the Russell 1000 Growth Index (IWF) went on to lose roughly -22% for calendar 2000, while the Russell 1000 Value Index (IWD), which had trailed in performance for the prior decade, actually delivered a positive return in the year 2000, gaining roughly 7%.

The performance difference was even greater in the smaller capitalization equities.

Value is due for a period of performance like this versus growth, and the key question is what are the best value stocks today.

Could the best value stocks actually be the downtrodden, out-of-favor commodity equities?

I think it is more likely than most market participants think.

Looking forward to a good discussion on this topic,

Travis