This has been my focus for a number of years, which has been to my detriment overall thus far, though 2020 seems to be the turning point, something I have referred to as the “Main Course” to 2016’s “Appetizer”.
A lot of analysts talk about historic opportunity in the markets when discussing stocks or portfolio strategy, yet this is “the real McCoy”.
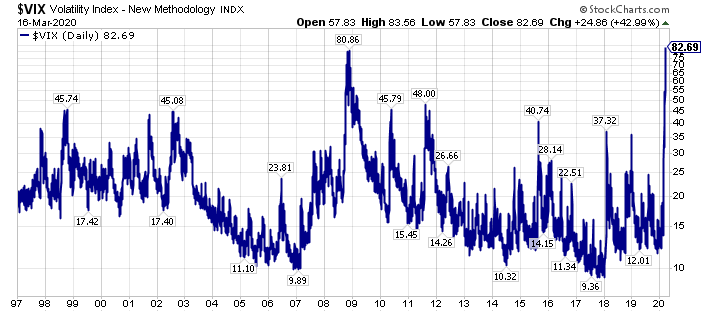
This is just a short post to document something remarkable.
Volatility is actually above 2008’s high levels.
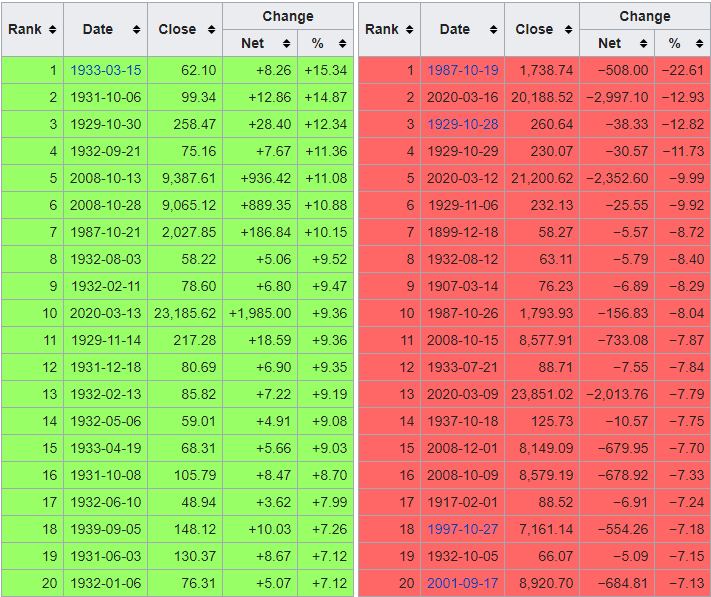
With the Dow Jones Industrial Average (DIA) posting is second worst percentage decline ever, and a cluster of recent days on the worst performing days list, perhaps the jump in volatility amid the COVID-19 pandemic should not be a surpise.
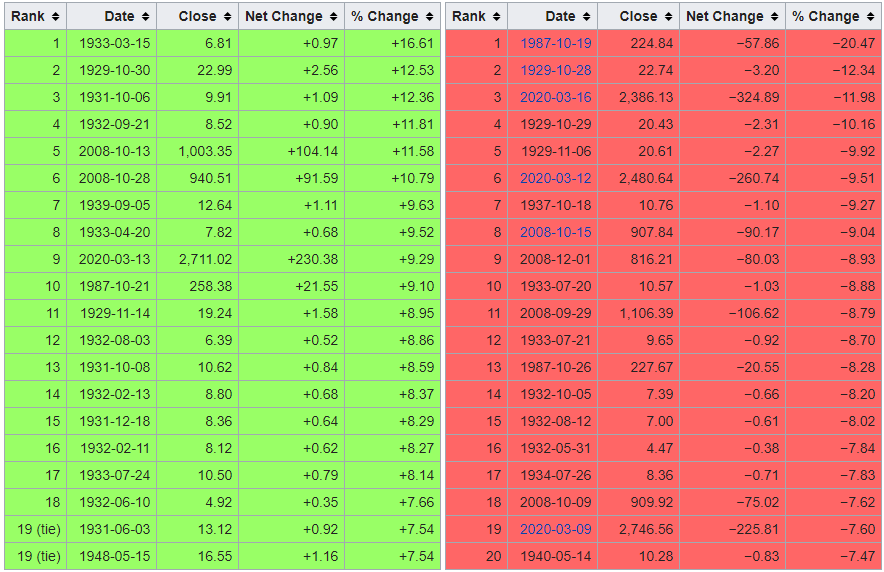
Adding to the narrative, the S&P 500 Index (SPY) posted its third worst percentage decline day ever.
Ultimately, volatility is opportunity, and this elevated volatility will not be around forever. Thus, I think market participants should be making their shopping lists for what to own on the long side.
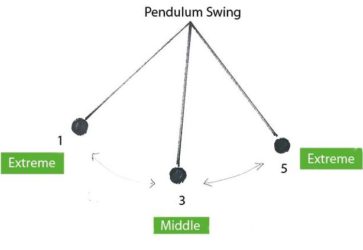
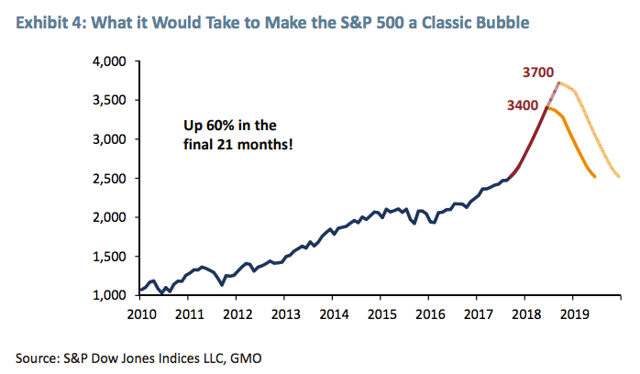
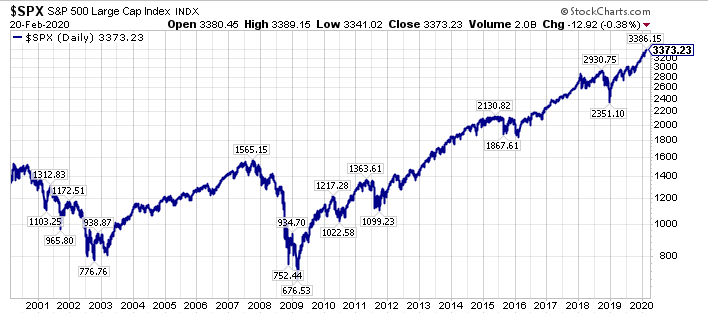
We have clearly followed the path of the classic bubble that GMO laid out in 2008 for the S&P 500 Index ($SPX), (SPY), which is shown below.
The timeline has been slightly different, I call it an extended classic bubble, the slower ride to the final destination. Regardless of the course, we are here now.
The key question is where do we go from here, and the answer, from my perspective, is all a function of interest rates, particularly longer-term sovereign interest rates. With the yield curve close to inverting again, and two Fed Funds rates cuts priced in right now as of this writing (February 21st, 2020) through the December 2020 FOMC meeting, a lot of pessimism is priced in.
Additionally, sovereign interest rates are so low, the question needs to be asked, “How much could they go down in the next recession?”
Last, but not least, what if a recession is averted, or we experience a mild recession, similar to what happened in the midst of the 2000-2002 bear market. On this note, the current investment landscape reminds me an awful lot of late 1999/early 2000, with the moonshot blow-off in Tesla ($TSLA), and the greater concentration in the top-five S&P 500 names ($SPY), which are Apple ($AAPL), Microsoft ($MSFT), Alphabet ($GOOGL), ($GOOG), Amazon ($AMZN), and Facebook ($FB) than in late 1999/early 2000.
We all know how that story ended, however, almost all market participants have forgotten that 2000-2002 time frame, hyper-focused on a fear of a reprisal of 2007-2009, which has led us to where we are today.
And where is that, you may ask?
The answer is that we are on the cusp of a historical capital rotation. Stay tuned.
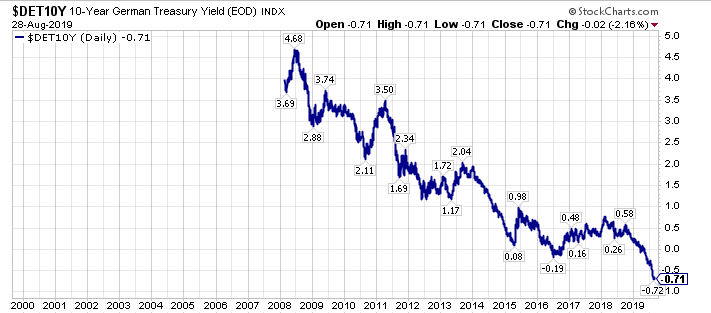
There is a bond bubble of epic proportions today. Nothing illustrates this bubble better than the German bond market, where the 10-Year German Treasury Yield is -0.71% annually.
Look at the above chart again, and think about the consequences. Who would buy a 10-Year Treasury, resigning themselves to an almost 3/4 percent nominal loss annually, which is amplified when measured in real terms?
We will revisit this question later in this post.
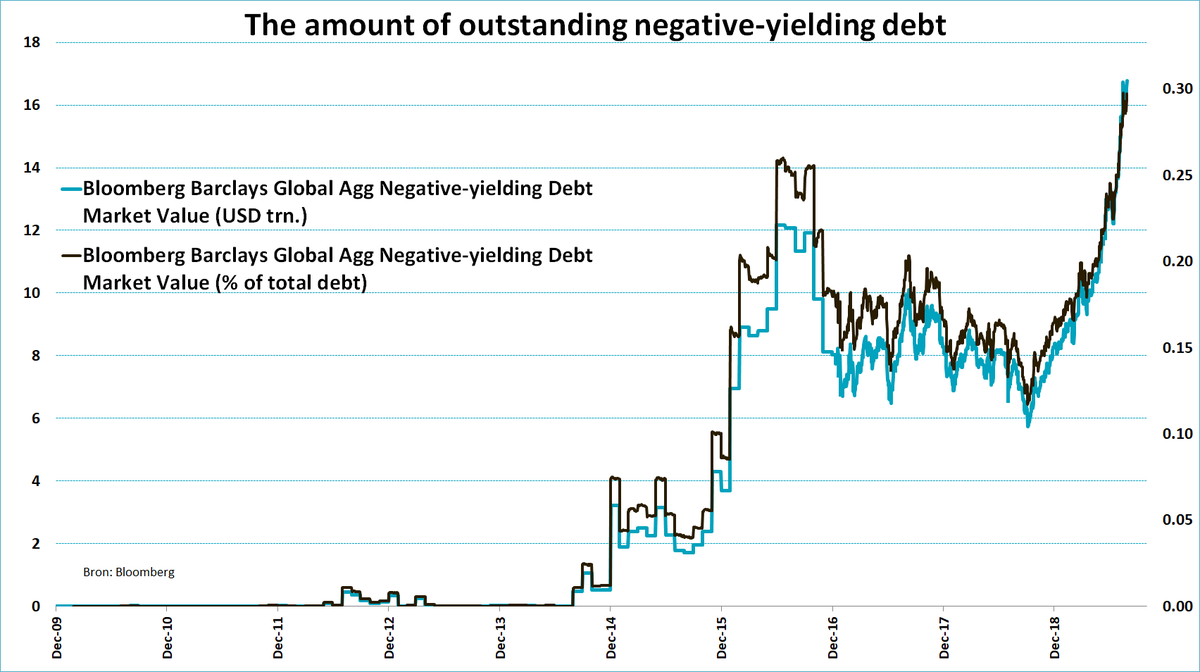
Building on the narrative above, there is over $16 trillion in negative yielding debt today, with negative yielding debt surpassing its previous 2016 high levels, so clearly there are a number of market participants who are currently willing to buy this negative yielding debt. From my perspective, these are mostly traders, who are flipping the bonds to the next buyer (a classic symptom of a bubble), and forced investors who are required to match the duration of their assets to their liabilities (think pension plans).
Looking at past bubbles, the irrationality of price insensitive buyers is prevailing right now in the bond market, however this is a temporary phenomena, something that will dissipate when the bubble dissipates.
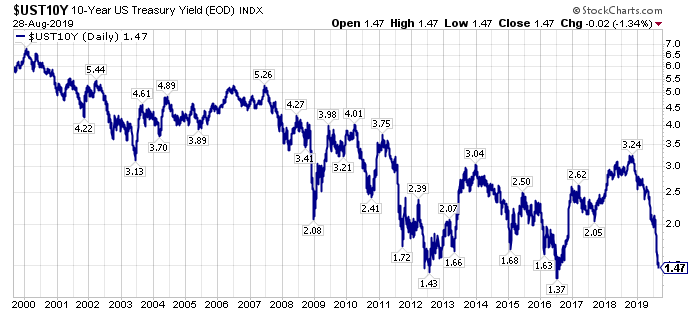
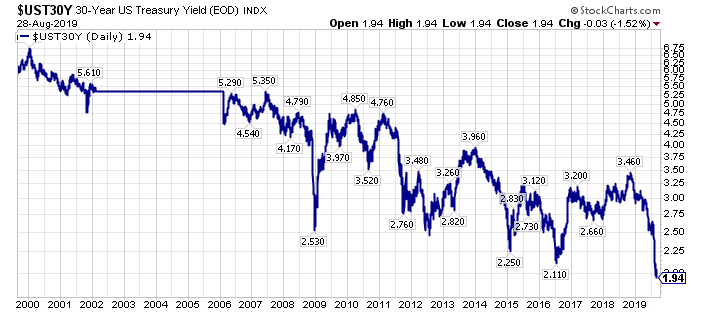
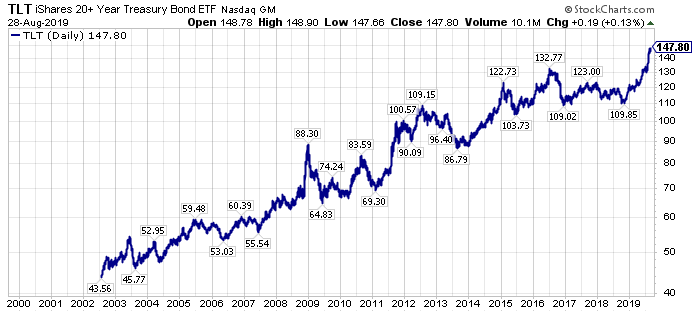
In the U.S., 10-Year Treasury Yields are not below their 2016 lows, at least as of this writing, however, 30-Year Treasury Yields have made new lows.
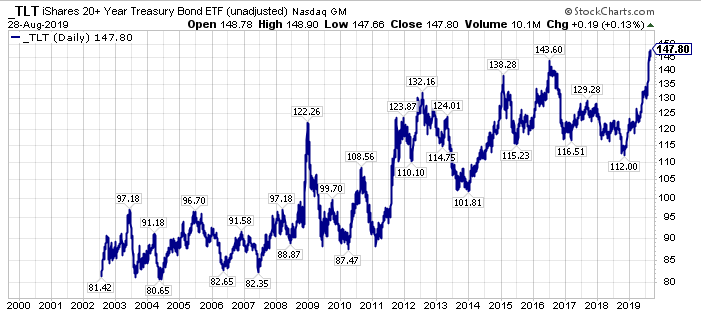
This has caused the iShares 20+ Year Bond ETF (TLT) to make new record highs, both on an adjusted, and un-adjusted basis.
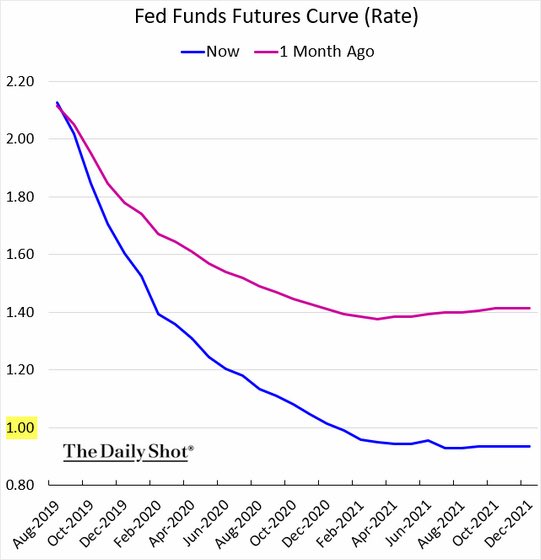
As long-term interest rates cascade lower, and yield curves invert, central banks are ratcheting down their short-term interest rate expectations. On this note, look at the Fed Funds Futures Curve one month ago (in red in the chart below) versus today’s expectations (in blue in the chart below).
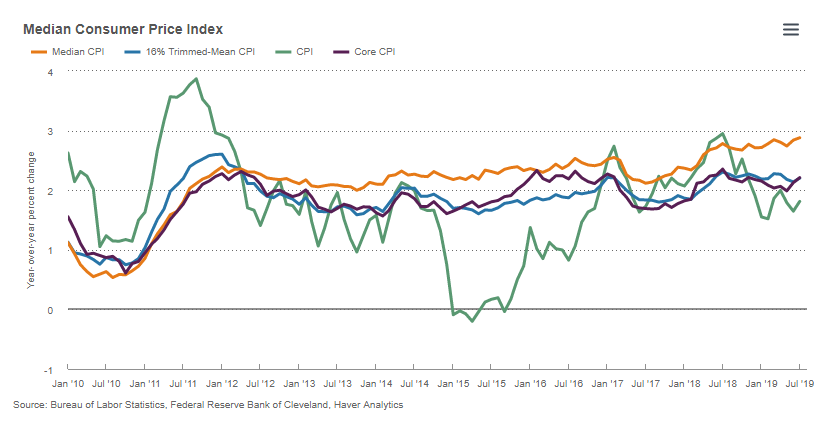
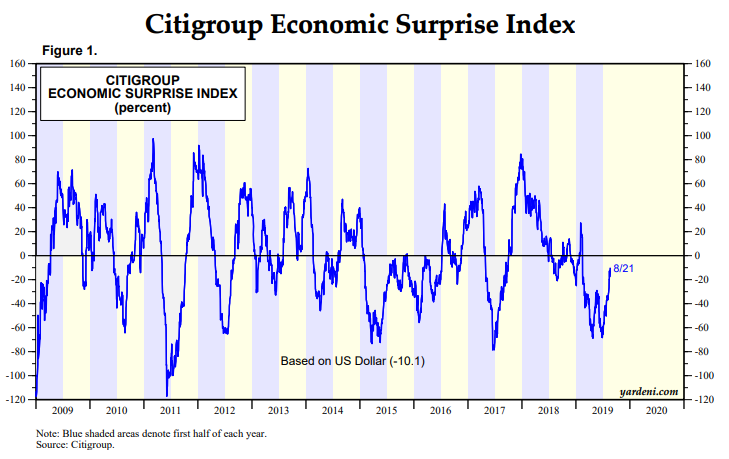
Short-term market projected interest rates are forecasting a steeper path downwards, mirroring the fall in longer-term interest rates, however this is happening as inflation readings, particularly the Median CPI (shown in yellow below), are at the highs of the current economic expansion in the U.S, and as the Citigroup Economic Surprise Index turns higher.
In summary, what happens when the Fed, and central banks ease into a cyclical upturn with bond prices at record highs?
We are about to find out, and if you have ridden this bond bubble, or have ridden some of the investments that have benefited from the bond bubble, specifically REITs (VNQ), (IYR), utilities (XLU), and the perceived higher quality investments, think stocks like Coca-Cola (KO), McDonald’s (MCD), and Procter & Gamble (PG), which have all levitated higher as interest rates have ratcheted lower, you should be thinking about your exit points, in my opinion.
Closing Thoughts – An Epic Bond Bubble With Sentiment At Extremes
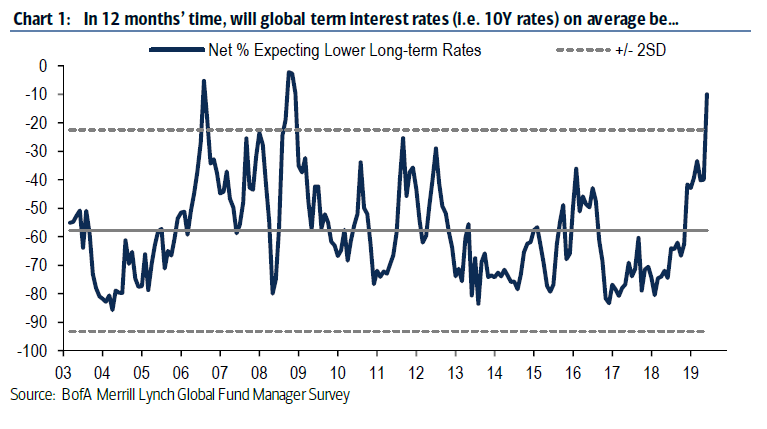
The bond market is at the tail-end of a blow-off bubble, from my vantage point. Sentiment is extremely stretched today, rising to exceed previous highs, which is shown below with this chart from June of this year.
Since June of 2019, daily sentiment readings have risen further, and bond bullishness regularly has exceeded the 2008 /2009 highs.
This bond bubble, is one of a series of bubbles today, which I noted in a recent article as follows:
“Respectfully, there are bubbles everywhere. Specifically in:
Confidence in central banks.
In bonds, with record bond ETF inflows near all-time price highs at the end of an almost 40 year bull market.
In yield-oriented Investments as central banks have pushed investors out the risk curve.
In growth stocks, which are the longest duration assets.
In passive investments, which are price insensitive buyers.”
Wrapping up, and circling back to the earlier question in the article, specifically, “who is buying these negative yielding bonds today”, the answer is primarily speculators, and like past manias, those left holding the “hot potato” are going to get burned.
For a look at a different research approach, I am offering a 20% discount to membership to “The Contrarian” (past members can also direct message me for a special rate), the lowest price point since the founding members price, where we have a live documented history dating back to late 2015, including an updated valuation and price target list for over 103 targeted companies, including several companies that offer upside appreciation potential that rivals the best opportunities of late 2008/early 2009, in my opinion.
Additionally, I am offering a limited time 50% discount for research services on this site. To get this offer, go here, and enter coupon code “august”.
Reach out with any questions.
Via my research services, or another avenue, please do your due diligence, and take advantage of what I believe is a historic inflection point,
WTK
P.S. Resilience, which I have written about, and not getting caught in the herd today (trades are more crowded today than in 1999 or 2007 from my perspective) is paramount for the investment landscape ahead, in my opinion.
Disclosure: I short tlt via put options.
Additional disclosure: Every investor’s situation is different. Positions can change at any time without warning. Please do your own due diligence and consult with your financial advisor, if you have one, before making any investment decisions. The author is not acting in an investment adviser capacity. The author’s opinions expressed herein address only select aspects of potential investment in securities of the companies mentioned and cannot be a substitute for comprehensive investment analysis. The author recommends that potential and existing investors conduct thorough investment research of their own, including detailed review of the companies’ SEC filings. Any opinions or estimates constitute the author’s best judgment as of the date of publication, and are subject to change without notice.
(Travis’s Note: This article was originally published on January 22nd, 2018, which, with the benefit of hindsight, ended up being near the peak in the global equity market. Much like 2000, though, when the NASDAQ peaked in March, then rolled over, however, the S&P 500 Index attempted to make a new high in the Fall of 2000, this time something similar happened, with global equities peaking in January, and then the U.S. stock market, specifically the S&P 500 Index, making new highs in the Fall of 2018).
There is no parallel for today’s price action.
Extremes are beyond extreme.
There will be a price to pay when overcrowded trades unwind.
One of my favorite authors is Malcolm Gladwell.
One of my favorite short stories is Gladwell’s 2002 New Yorker article “Blowing Up“, about Nassim Taleb & Victor Niederhoffer.
One of my favorite passages (I have many) from this article is the following:
Physical events, whether death rates or poker games, are the predictable function of a limited and stable set of factors, and tend to follow what statisticians call a “normal distribution,” a bell curve. But do the ups and downs of the market follow a bell curve? The economist Eugene Fama once studied stock prices and pointed out that if they followed a normal distribution you’d expect a really big jump, what he specified as a movement five standard deviations from the mean, once every seven thousand years. In fact, jumps of that magnitude happen in the stock market every three or four years, because investors don’t behave with any kind of statistical orderliness. They change their mind. They do stupid things. They copy each other. They panic. Fama concluded that if you charted the ups and downs of the stock market the graph would have a “fat tail,”meaning that at the upper and lower ends of the distribution there would be many more outlying events than statisticians used to modelling the physical world would have imagined.
Reflecting on a personal level, I have characteristics of both Taleb and Niederhoffer, and I have endured and caused a lot of pain in 2017, both daily , and on a cumulative basis.
Reflecting on the markets, we remain in an unnatural state, where the S&P 500 (SPY) has risen 15 straight months on a total return basis.
It is a melt-up of epic proportions, which comes after an already epic bull market, and the consistency of the advance for the broader market, and for the “Have” stocks (the “Have Not’s” have been left behind in an equally historic move) has removed any objectivity from analysts, speculators, and investors.
To close, we have to chronicle the magnitude and the extremes of the price action, and realize that when crowded trades unwind, there will be nobody else to take the other side of the trades.
Disclosure: I am/we are short SPY As A MARKET Hedge.
Additional disclosure: Every investor’s situation is different. Positions can change at any time without warning. Please do your own due diligence and consult with your financial advisor, if you have one, before making any investment decisions. The author is not acting in an investment adviser capacity. The author’s opinions expressed herein address only select aspects of potential investment in securities of the companies mentioned and cannot be a substitute for comprehensive investment analysis. The author recommends that potential and existing investors conduct thorough investment research of their own, including detailed review of the companies’ SEC filings. Any opinions or estimates constitute the author’s best judgment as of the date of publication, and are subject to change without notice.