Introduction
This weekend, I was putting together performance data (more to come on this front shortly), and the continued out-performance of growth equities was noticeable enough that I decided to pen an article for members about it.
Going back a decade, growth stocks have trounced value stocks in the United States, and the longer-term out-performance of growth stocks over their value counterparts is eye-opening.
Thus, I wanted to highlight the performance differential, to explore what it means, and contemplate how it will be resolved.
Growth Is Outperforming Year-To-Date
Compared to a historically low equity volatility year in 2017 (really almost all financial assets had low volatility in 2017), volatility has certainly picked up in 2018. However, that has not impacted the out-performance of growth equities, yet.
Year-to-date in 2018, the iShares Russell 1000 Growth ETF (IWF) is higher by 12.3%, significantly outpacing the returns of the iShares Russell 1000 Value ETF (IWD), which is higher by 1.7%.
Looking at smaller capitalization equities, the same trends are holding true, with the iShares Russell 2000 Growth ETF (IWO) higher by 13.3% year-to-date, while the iShares Russell 2000 Value ETF (IWN) is higher by a still healthy 7.5% year-to-date through Friday, August 10th, 2018.
There is no question that growth stocks continue to lead their value counterparts in 2018.
This trend has persisted for roughly a decade, with sporadic periods of value out-performance, including most of calendar year 2016, yet these periods of value out-performance have been false starts thus far.
Growth Is Outperforming The Past Decade
Going back ten years, the iShares Russell 1000 Growth ETF has increased 215.6%, while the iShares Russell 1000 Value ETF is higher by 126.2%, which is not to shabby on an absolute basis, or even a relative basis compared to most international and emerging market equity ETF’s, yet the performance differential versus the Russell 1000 Growth is historically wide.
This performance differential persists in the small-cap arena too, with the iShares Russell 2000 Growth ETF higher by 189.5% over the prior decade, while the iShares Russell 2000 Value ETF is higher by 138.7%.
Interestingly, the performance gap between the Russell large-cap growth and value ETF’s, which stands at 89.4% over the last ten-years, is larger than the the performance gap between the Russell small-cap growth and value ETF’s, which have a 47.8% performance differential.
Clearly, the Russell 1000 Growth ETF has been positively impacted by the historic run in mega-cap growth stocks, including Amazon (AMZN), which is up 2242.9% over the past decade, Apple (AAPL), which is up 866.8% over the past decade, Alphabet (GOOGL), which is up 405.6% over the past decade, Microsoft (MSFT), which is up 397.8% over the past decade, and Netflix (NFLX), which is up a remarkable 7697.4% over the past decade.
On this note, one of my biggest mistakes in what was a wonderful 2008-2010 time period for me personally investment wise, was not identifying what was rare, which was growth, in a low growth world.
Elaborating further, I had invested substantially in the first video streaming company that I am aware of, which was Intraware, in 1999, so I saw the potential for a stock like NFLX, yet while NFLX was playing out in front of my eyes, my value bias prevented me from investing in what was a phenomenal growth opportunity.
Recent Small-Cap Out-performance Holds Clues
If you are a market historian, you know that the best long-term asset class, in terms of performance, is small-cap value. The Ibbotson data, which is now part of Morningstar, illustrates this clearly.
However, looking at the data above, small-cap value stocks, as measured by the Russell 2000 Value ETF, are the second worst performing group over the past decade, trailing large-cap growth equities, small-cap growth equities, and only moderately ahead of large-cap value stocks, as measured by the Russell 1000 Value ETF.
Thus, small-cap value stocks (incidentally many of our favored U.S. commodity equities, which are illustrated on the Top-Ten List, are now classified as small-cap value equities) are due for a period of out-performance, which would be in sync with the long-term Ibbotson data.
Somewhat surprisingly, given the perception of today’s stock market leadership, U.S. small-capitalization equities have out-performed their large-cap counterparts year-to-date in 2018 as shown above.
This raises some interesting questions, which I am brainstorming out loud as follows:
- Perhaps the U.S. stock market is not as near rolling over as believed, or as projected, as a resurgence in U.S. small-cap equities would not align with the narrative of narrowing market leadership?
- Perhaps we have not reached the late-stage cycle of the investment cycle road map?
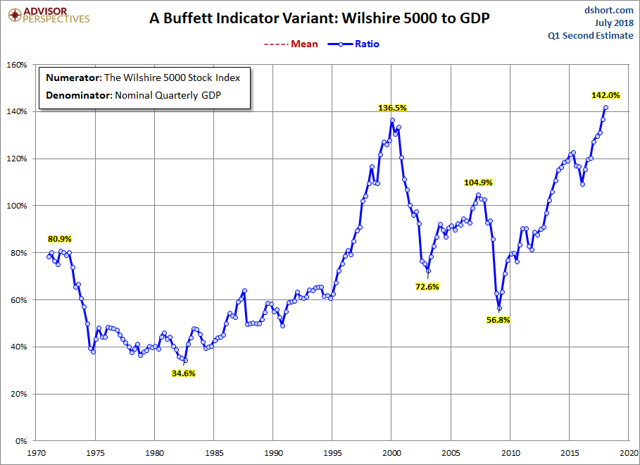
For someone who has believed that the current U.S. equity market is historically overvalued, specifically even more overvalued than 1999 or early 2000, I am trying to think outside-the-box to see how the current high valuation investing could be resolved.
Look For A 2000 Repeat Of Value Over Growth
This past week, I officially turned 41, and looking back to 2000, when the Russell 1000 Growth and Value ETF’s were just formed, I am officially feeling older.
As you can see from the charts above, the Russell 1000 Growth & Value ETF’s came out in late May of 2000. From late May of 2000, through year-end 2000, the Russell 1000 Growth ETF was down -17.2%, while the Russell 1000 Value ETF was higher by 8.6%.
From memory (the Russell 1000 Performance calculator will verify), the Russell 1000 Growth Index finished 2000 lower by roughly -22%, while the Russell 1000 Value Index finished higher by roughly 7%.
Thus, in one year, a significant portion of the growth minus value performance gap, that had built up over the prior decade, from 1990 to 1999 was erased.
Building on this narrative even further, the 2000-2002 bear market in U.S. equities, which saw the S&P 500 Index (SPY) decline by roughly 50% from peak to trough, occurred alongside a very mild recession.
Could something similar happen today?
Going even further, could we see the S&P 500 Index, and more specifically the historically outperforming growth equities, decline substantially outside a recession, or even if economic growth picks up?
Takeaway – Growth’s Run Over Value Is Getting Long In The Tooth
Growth stocks have dominated value equities over the past decade.
This has emboldened growth investors, and taken the spirit out of value investors.
The comparisons between today’s market environment, and the one that existed in the late 1990’s is apt, and this is coming from someone who was an active, contrarian value investor in both time periods.
Both growth and value investors should be on the lookout for a reversion-to-the-mean in performance.
When this inevitably happens, I think the performance-gap between growth and value investments will be bigger, in-favor of value, than it was from 2000-2002.


