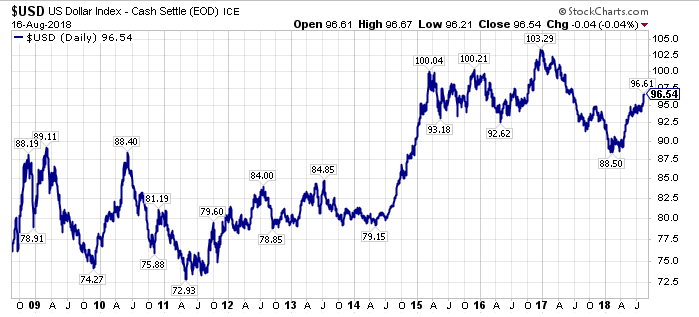
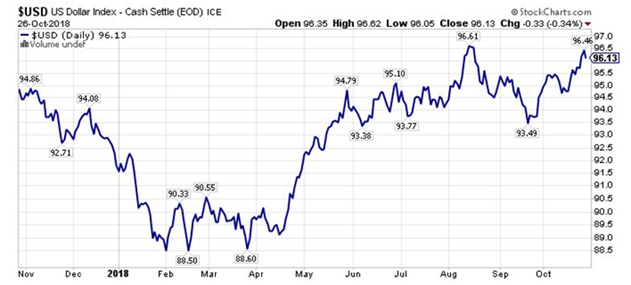
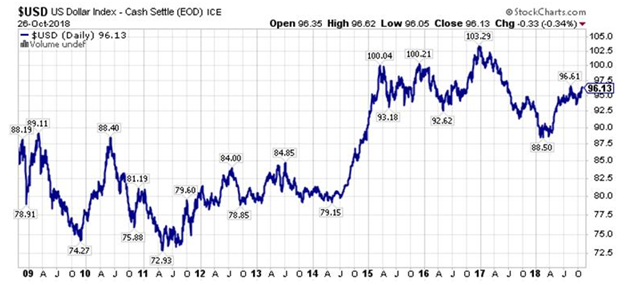
This past week saw extremely volatile price action in the broader equity markets, though other market barometers behaved much more normally, including the U.S. Dollar Index, down -0.4% for the week, which is surprising price action in an environment where U.S. stocks and bonds have been the safe-haven’s for global capital flows for the past decade.
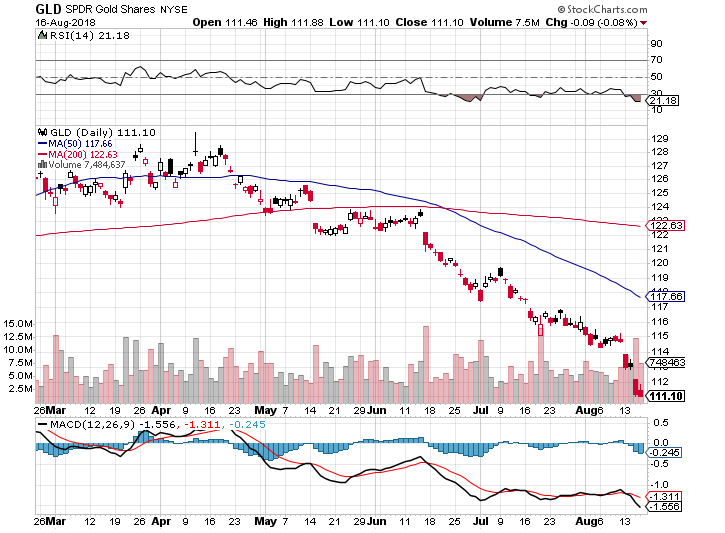
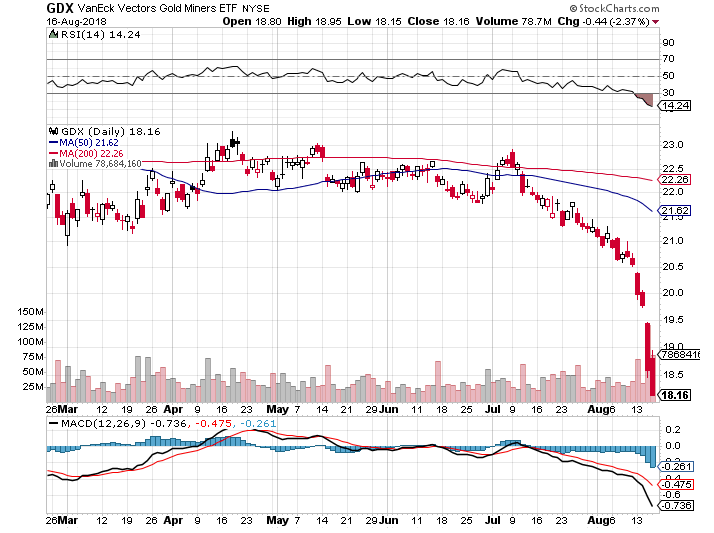
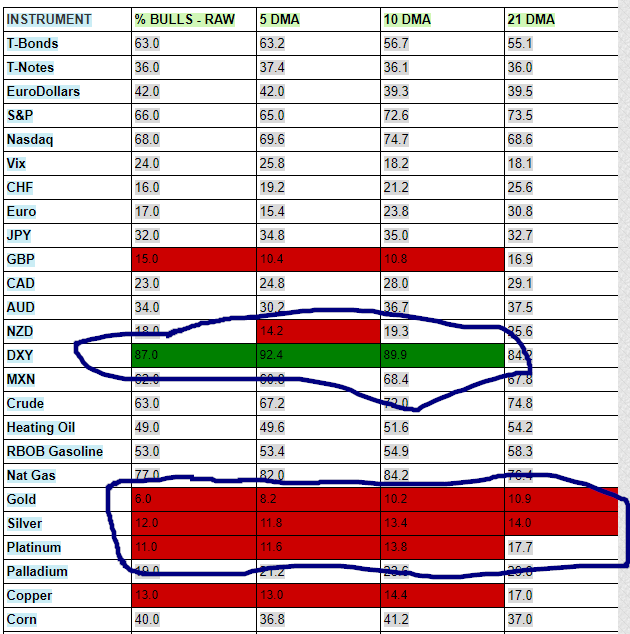
Commodities, the red-headed step child of the three major asset classes the past decade (stocks, bonds, and commodities), also performed surprisingly well, with copper prices up 1.4% on the week, gold prices (GLD) up 1.3% on the week, natural gas prices (UNG) higher for their fourth week in a row by 0.6%, and precious metals equities (GDX) and smaller precious metals equities (GDXJ) up 5.9%, and 6.1% respectively.
The notable exception in the commodity space was oil (USO), and energy equities, which both finished down sharply for the week, with oil prices lower by -4.0% ($WTIC), and -4.2% ($BRENT). Energy equities declined even more, with large-cap energy stocks (XLE) down -5.4%, smaller exploration and producers (XOP) down -5.7%, including a -14.8% loss in California Resources Corp (CRC), one of the leading performing energy equities in 2018, and oil service stocks (OIH) down -5.5% for the week.
Ironically, the energy sector had been a bright spot in the commodity space this year before the rout last week, and year-to-date returns for oil, and for some energy equities are still healthy. However, energy equities have generally lagged the rise in oil prices since their lows in 2016, and this still represents a material opportunity, from my vantage point.
To provide a bigger picture perspective, here are the following year-to-date returns through Friday’s close (October 12th, 2018).
Dow Jones Industrial Average (DIA) – Up 4.0%
Invesco QQQ Trust (QQQ) – Up 12.5%
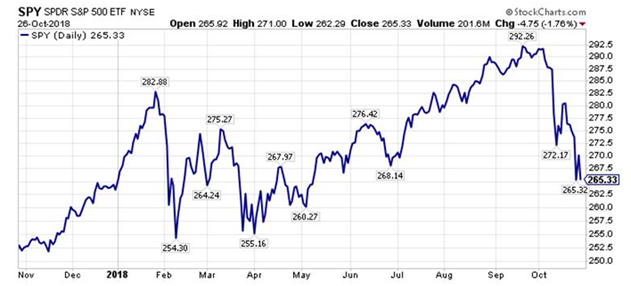
S&P 500 Index (SPY) – Up 4.8%
iShares 20+ Year Treasury Bond (TLT) – Down -8.0%
iShares U.S. Real Estate (IYR) – Down -4.1%
MSCI EAFE (EFA) – Down -7.4%
Emerging Market Equities MSCI (EEM) – Down -13.9%
Chinese Large-Cap Stocks (FXI) – Down -12.0%
$WTIC Oil Prices – Up 18.1%
$BRENT Oil Prices – Up 20.5%
$NATGAS Prices – Up 7.0%
Large-Cap Energy Stocks (XLE) – Up 3.1%
Smaller-Cap E&P Energy Stocks (XOP) – Up 11.3%
Oil Service Stocks (OIH) – Down -7.0%
Copper Prices – Down -15.2%
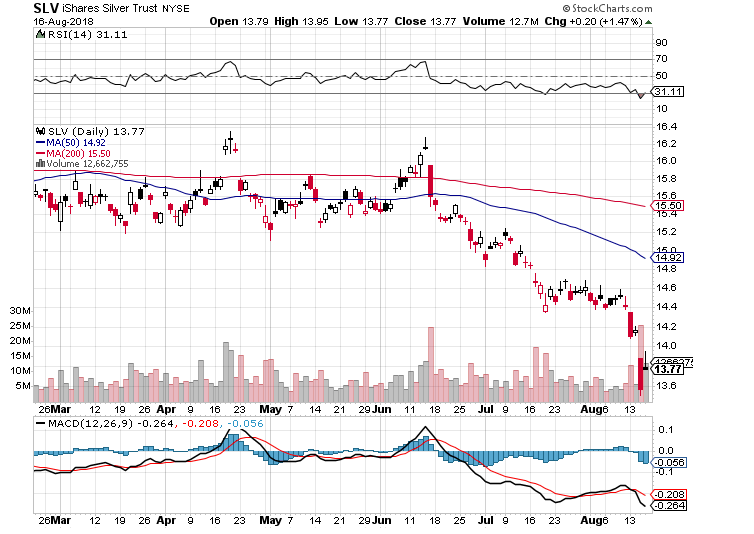
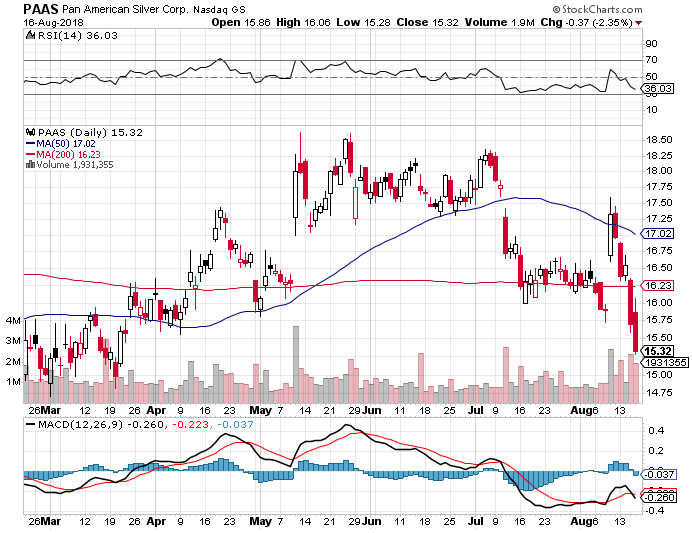
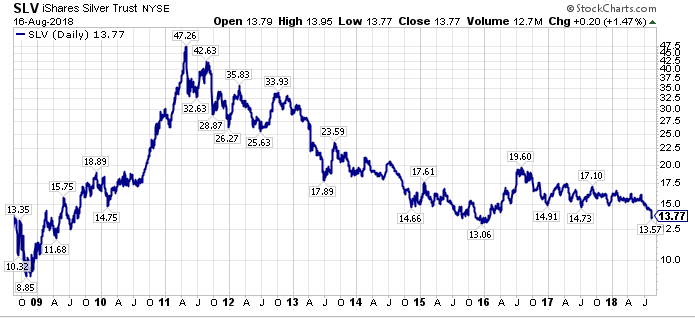
Silver Prices – Down -14.6%
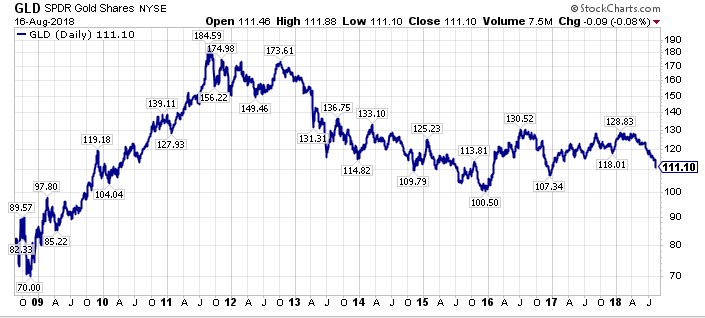
Gold Prices – Down -6.8%
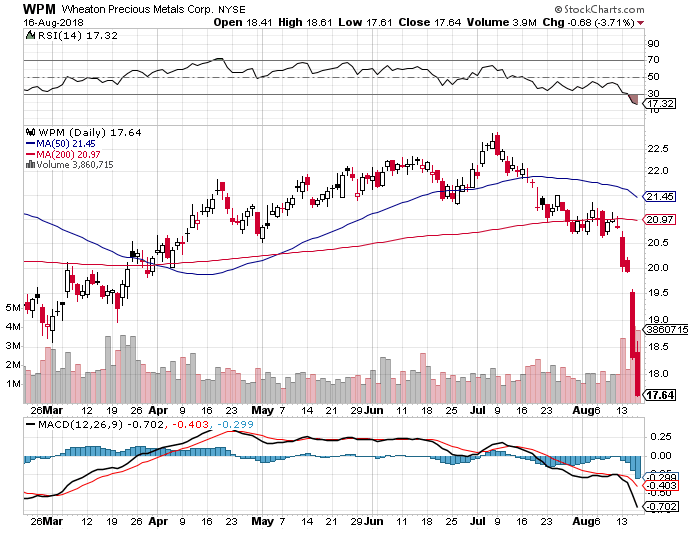
Large-Cap Precious Metals Stocks (GDX) – Down -15.0%
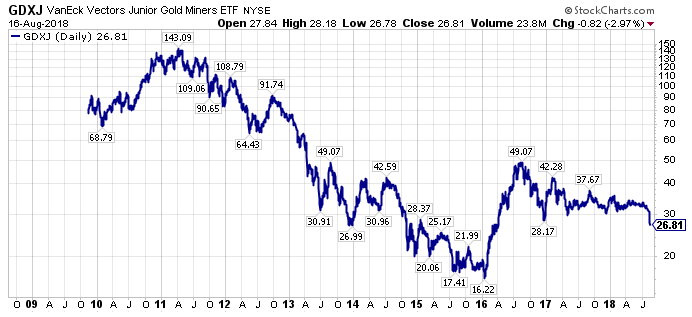
Small-Cap Precious Metals Stocks (GDXJ) – Down -14.2%
Looking at the YTD performance of the various sectors selected above, the NASDAQ QQQ Trust, and crude oil prices are the winners, thus far, in 2018, while precious metals, and precious metals equities have been at the bottom of the performance metrics.
Last week provided a reversal in this performance ranking, with precious metals equities leading a rebound, while the broader U.S. stock market leaders sold off sharply.
Will this price action market a turning point?
It is too soon to tell right now, however, similar to late 2015/early 2016, or late 2008/early 2009, or in late 1999/early 2000, the price action in precious metals equities might be signalling that a capital rotation is imminent, out of winners of the past decade, and into more value-oriented opportunities, including commodities, or international equities.
Building on this narrative, despite the strength of oil prices since the secular bottom in commodity prices in 2016, which preceded the secular top in the bond market in 2016, commodities still represent a generational opportunity, especially relative to U.S. equities, as measured by the S&P 500 Index.
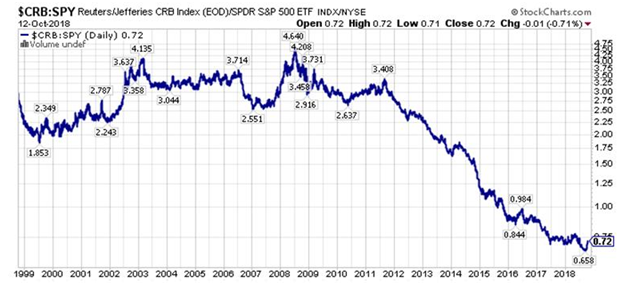
Looking at the chart above, at some point, there is going to be a massive reversion-to-the-mean trade in commodities versus U.S. equities, bigger than what we saw even after U.S. equities topped in 2000.
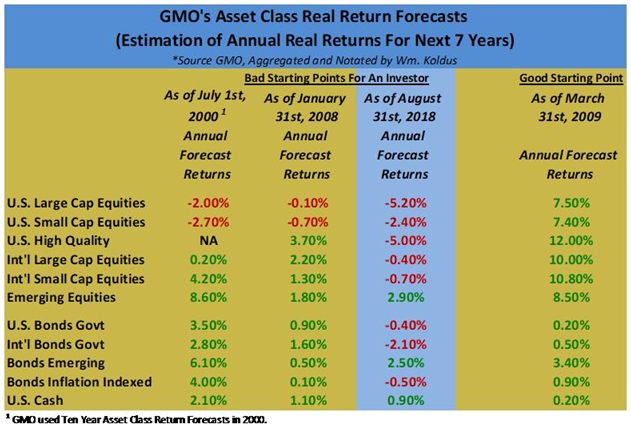
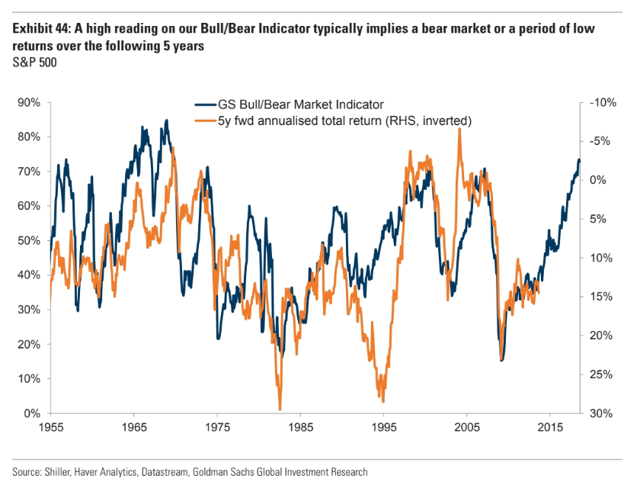
Meanwhile, U.S. stocks are poised to deliver their worst real returns in modern market history, according to data I tabulate from GMO (shown in the table below), and also according to other real return forecasts, including Goldman Sachs (GS), whose Bull/Bear Market Indicator of future returns is shown below the GMO table.
Wrapping everything up, a different Portfolio construction is going to be needed in the next 10 years, compared to the past 10 years.
Simply sitting out the market in cash is not a bad idea in my opinion, especially as short-term interest rates rise, though I believe there will be extraordinary opportunities in out-of-favor equities, specifically in commodity equities, and selected international equities, whom all have been thrown overboard on a absolute and relative return basis over the past decade.
Getting to these returns, however, has not been easy, as the broader financial markets are at major inflection points, including potentially the end of a 35+ year bull market in bonds, and potentially the end of an extraordinary bull market in U.S. equities, which has been fueled by investor distrust for a majority of the past decade.
The length of the prevailing market trends means that psychology and sentiment are uniquely ingrained, so in my opinion, this makes inflection points more volatile, and harder to navigate.
An alternative to simply sitting in cash, at least in my opinion, is for investors to have a significant part of their core asset allocation in a long/short portfolio.
Building on this narrative, since trend following has dominated equity market price action the past decade, fueled by passive index and ETF flows, as this comes to an end, it should be a golden age of opportunity for active investors.
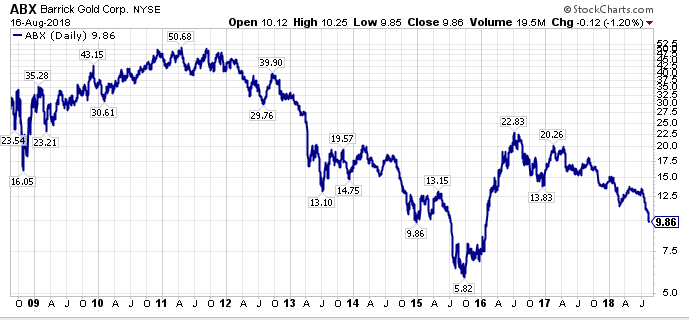
In closing, the Contrarian All Weather Model Portfolio had a very good performance week, on both a relative and absolute basis, as the offsetting short positions in SPY finally paid some dividends, and several long positions, including RH (RH), which announced another stock buyback (I wish RH’s management could be ported over to SWN, RRC, AR, CHK, X, etc.), and Barrick Gold (ABX), which rose 9.0% and 8.7%, respectively.
On the negative side of the ledger, American Airlines (AAL), which I think is remarkably cheap, and an opportunity here, continued its free-fall, falling -15.2%, and shares of AAL are now down -40.2% YTD in 2018.
Union Pacific Corp (UNP), a previous bull market leader in 2018, also stumbled last week, with shares falling -6.8% for the week, though shares are still higher by 15.6% in 2018. Sothebys (BID) also continued its move down, falling -4.1% last week, and shares of BID are down -16.6% in 2018. I keep an eye on BID shares, as they have had a history of leading broader market moves.
Without further ado, the latest Contrarian All Weather Model Portfolio Update is presented below.

 Interesting, to say the least.