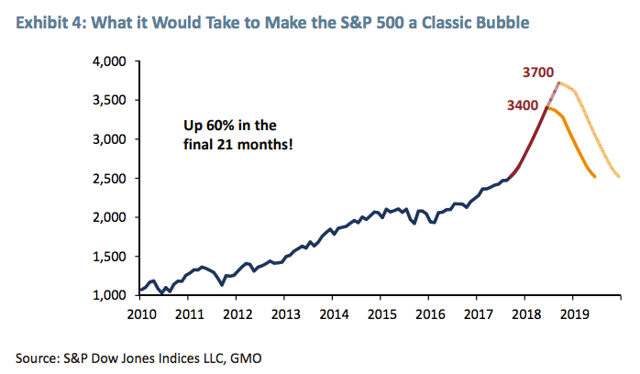
We have clearly followed the path of the classic bubble that GMO laid out in 2008 for the S&P 500 Index ($SPX), (SPY), which is shown below.

The timeline has been slightly different, I call it an extended classic bubble, the slower ride to the final destination. Regardless of the course, we are here now.

The key question is where do we go from here, and the answer, from my perspective, is all a function of interest rates, particularly longer-term sovereign interest rates. With the yield curve close to inverting again, and two Fed Funds rates cuts priced in right now as of this writing (February 21st, 2020) through the December 2020 FOMC meeting, a lot of pessimism is priced in.
Additionally, sovereign interest rates are so low, the question needs to be asked, “How much could they go down in the next recession?”
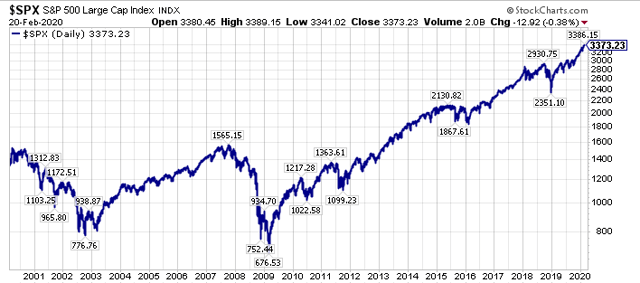
Last, but not least, what if a recession is averted, or we experience a mild recession, similar to what happened in the midst of the 2000-2002 bear market. On this note, the current investment landscape reminds me an awful lot of late 1999/early 2000, with the moonshot blow-off in Tesla ($TSLA), and the greater concentration in the top-five S&P 500 names ($SPY), which are Apple ($AAPL), Microsoft ($MSFT), Alphabet ($GOOGL), ($GOOG), Amazon ($AMZN), and Facebook ($FB) than in late 1999/early 2000.
We all know how that story ended, however, almost all market participants have forgotten that 2000-2002 time frame, hyper-focused on a fear of a reprisal of 2007-2009, which has led us to where we are today.
And where is that, you may ask?
The answer is that we are on the cusp of a historical capital rotation. Stay tuned.


