Introduction Note From Travis
We have had a good discussion in The Contrarian lately regarding the Fed, specifically their pace of interest rate increases, and how close we are to the end of the current market cycle.
This has got me thinking, researching, and discussing, the end-game to this cycle over the past several days, and I wanted to put these thoughts on the proverbial paper.
Ultimately, I believe the Fed is behind the cycle, and the late-stage cycle investments are only at the beginning of their rally, with the first leg higher in these assets occurring in 2016, and the next leg higher set to commence, perhaps imminently.
Thesis
The Federal Reserve and the rest of the world’s central banks fear deflation, as 2007-2009 is still planted firmly in their minds, and thus monetary policy has stayed looser for longer, and will continue to do so, resulting in elongated investment cycles and a long runway for inflationary assets.
Fed Is Behind The Curve
On March 16th, 2017, I published an article for members of The Contrarian titled, “Market Historian – What Happens When The Fed Hikes Rates“, examining what happens to the markets in Fed tightening cycles.
Midway through the article, which looking back was very prescient (and I wish I would have followed my own rationale, reasoning, and logic better in 2017), I talked about the Taylor Rule, and posted a chart showing the differential in the Fed Funds Rate, and what the Fed Funds Rate would be projected to be under the Taylor Rule.
Back in March of 2017, the gap between the actual Fed Funds Rate and the Fed Funds Rate predicted by the Taylor Rule was pretty large, around 4%.
As economic growth in the United States has accelerated, and Fed Fund Rate increases have lagged past rate hiking cycles, that differential gap has widened further today.
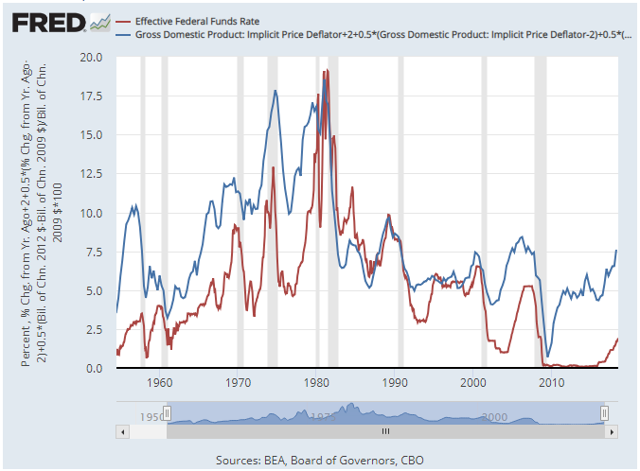
With the Effective Federal Funds Rate hovering around 2%, and the Taylor Rule projecting the Federal Funds Rate should be 7.5% today (read that again and think about it) the gap between the projected Fed Funds Rate by the Taylor Rule, and the actual Fed Funds Rate has widened to 5.5%.
In summary, even though the Fed has accelerated their pace of tightening in 2018, they have actually allowed monetary policy to become looser relative to economic growth, and this easy monetary policy environment has the potential to spark an inflationary boom, which would be the best possible environment for inflationary equities, specifically commodity equities.
2004-2006 Tightening Cycle As A Comparison
The Fed has been predisposed to easier monetary policy for a long time. The graph above would date this predisposition to around 1990, and as a market historian, I would say it began earlier, really with Fed Chairman Greenspan, particularly following the October 1987 U.S. stock market crash, where the Fed began easing interest rates immediately, after tightening them from February of 1987.
After the 2000-2002 U.S. stock market downturn, the Federal Reserve was noticeably slower to raise interest rates, waiting all the way until June of 2004 to lift rates from the 1% bottom.
Remember, 2003 was a very strong year for risk assets, so the Fed waited the entirety of 2003 and into 2004, and then they began raising rates at a steady pace.
How steady?
As I wrote in the member Market Historian article, the Fed raised rates 17 times from June of 2004 to June of 2006, which was a much faster rate hike cycle than we have seen in the current economic expansion and equity bull market.
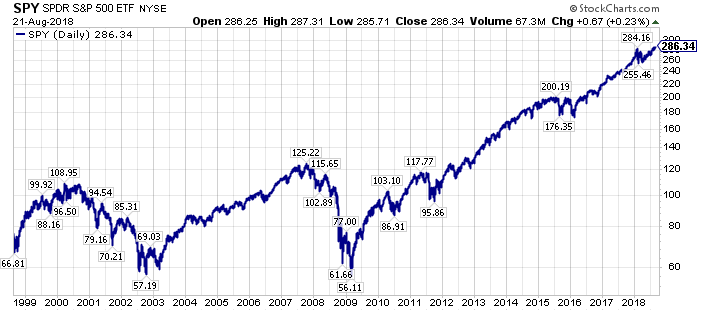
Interestingly, the Fed stopped tightening in June of 2006, about a year-and-a-quarter before the U.S. stock market, as measured by the SPDR S&P 500 ETF (SPY), peaked late in 2007.
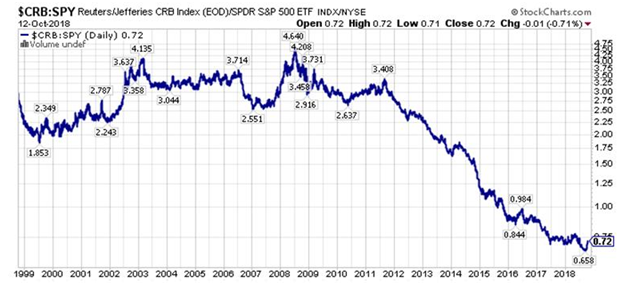
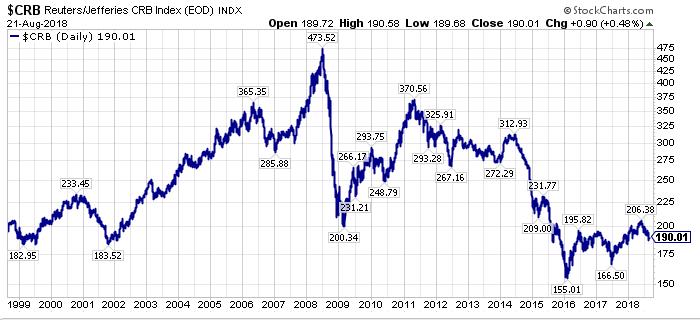
 Adding to the narrative, commodity prices increased during the Fed tightening cycle in June of 2004 to June of 2006, adding to their advances from 2001 through June of 2004.
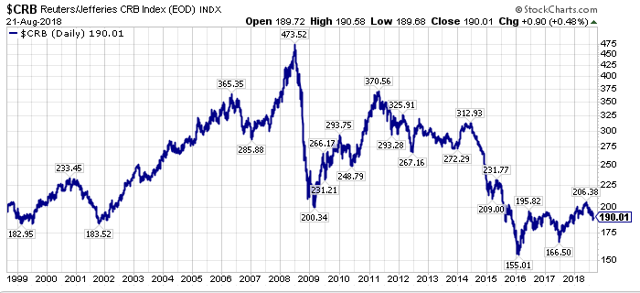 The price action of commodities in the chart above from 2004-2008 is of particular interest today, as I believe we are on the same path with regards to the economic cycle and financial markets today as were were back then.
Specifically, index funds dominated fund flows from 2003-2007, in a prelude to what we have seen during the current bull market, and volatility was muted, before an unwind.
It is my personal belief that the current U.S. equity bull market is sort of a hybrid between the 1990-2000 U.S. equity bull market, with growth assets dominating as I wrote about recently for members, and the 2003-2007 U.S. equity bull market, when passive flows became the go to investment vehicle for institutions on the traditional equity side.
Cycles Are Extended
With the Federal Reserve, and the world’s central banks sticking with a policy of negative real interest rates for longer than ever before, I believe investment cycles have lengthened.
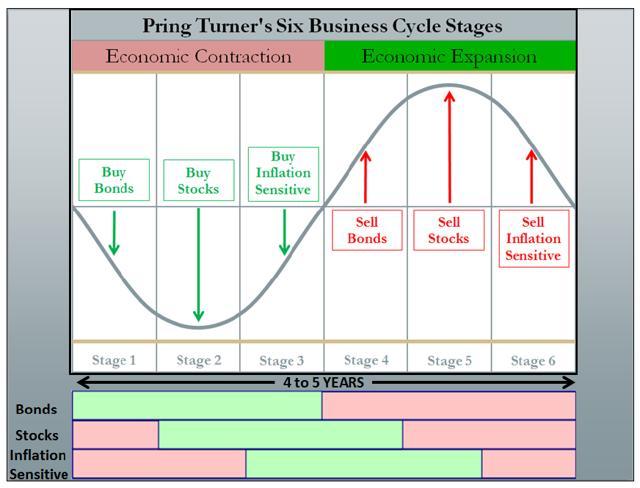
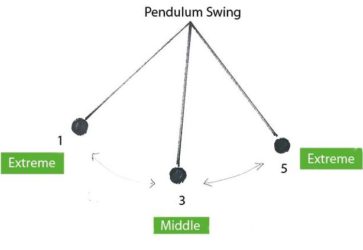
From the Martin Pring graphic above, I think bonds have topped, with sovereign bonds making their secular highs (lows in yields) in 2016, so we are somewhere between Stage 4 and perhaps at the early part of Stage 5.
Keep in mind, the 4-5 year time-frame in the graphic above applied to U.S. markets historically, so again, I think investment cycles, especially on a global basis, have been elongated, so each stage of the cycle could be running 2x to 3x what is shown above.
For that reason, the current investment landscape, with large-cap growth outperforming has seemingly persisted forever.
This is the bad news.
The good news is that the other stages should be elongated too, so there should be an even longer runway for our favored late-stage asset plays today.
Investment Implications
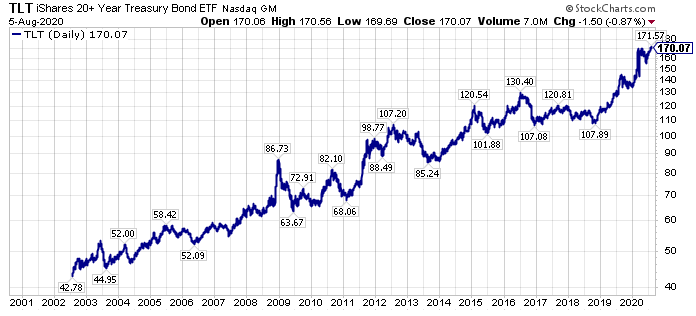
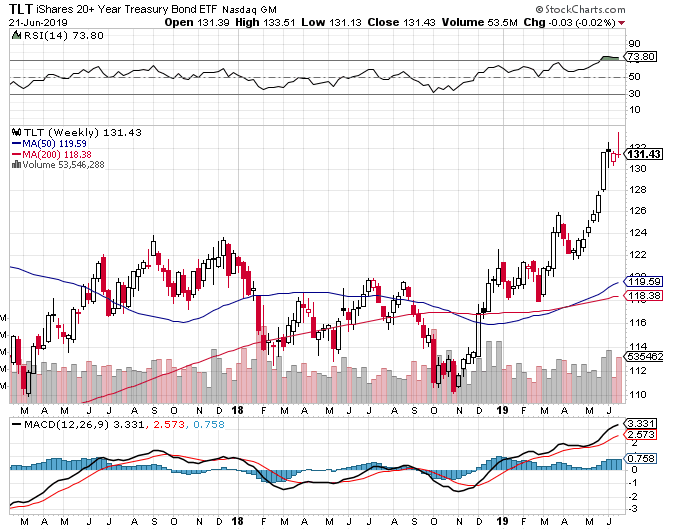
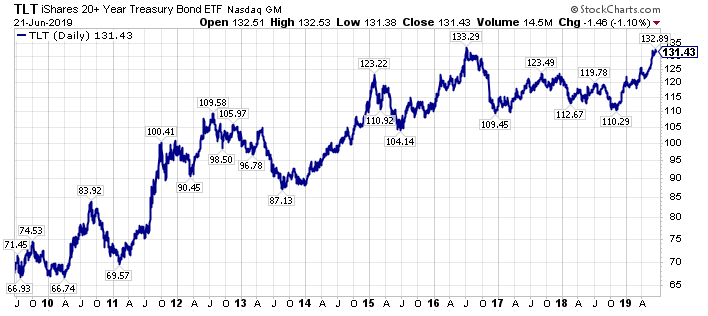
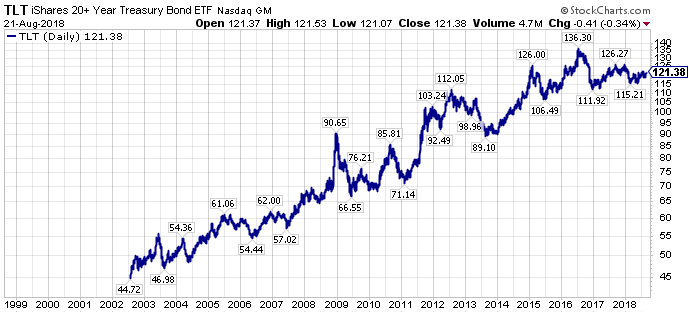
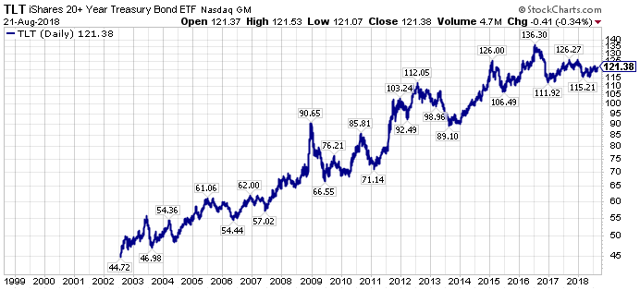
The first thought that comes to mine is to buy iShares 20+Year Treasury Bond ETF (TLT) puts.
 Why?
Why?
1. The Fed is clearly way behind in their interest rate hiking cycle, and adding to this narrative, they may stop at a terminal rate that is significantly below what could be called for in a higher growth/higher inflation landscape.
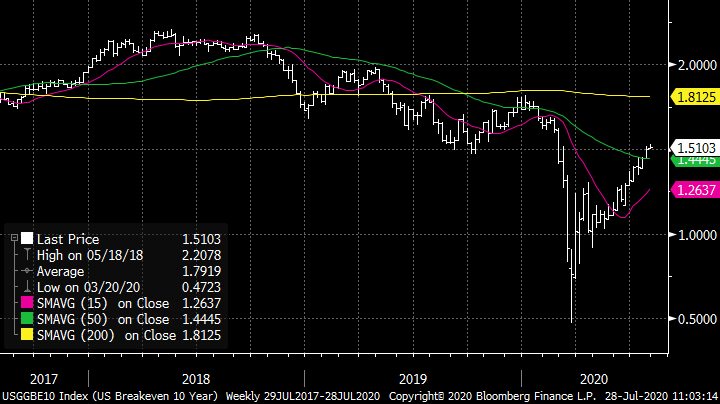
2. Sovereign interest rates have clearly bottomed in 2016, yet there is a reluctance to embrace this right now, and with 2007-2009 still fresh in most investor’s minds, the natural inclination is to buy bonds for a safety trade.
The second thought is that commodity equities, which have dominated the Top-Ten List, should be primed for their second leg higher.
The SPDR S&P Oil & Gas Exploration & Production ETF (XOP), which is already in the midst of its second leg higher, with the first leg occurring from the Spring of 2016 through the end of 2016, followed by a difficult pull-back for the majority of 2017, before embarking on the beginning of its second leg higher in the depths of despair in 2017, is a good leading indicator for the rest of the commodity complex today, in my opinion.
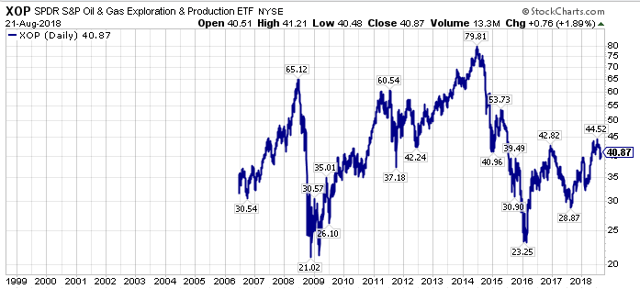 Thus, if XOP continues its uptrend of higher highs and higher lows, I think this will be a good sign for commodity equities in general, a few of which I have identified as particularly juicy opportunities, at least from my vantage point, in a recent member post titled Volatility Creating Opportunity.
The third thought that is on my mind is that the current equity bull market could go on longer than expected, as the late-stage cycle investments, have not really even gotten underway in what should be a longer than normal time-frame for late-stage cycle assets.
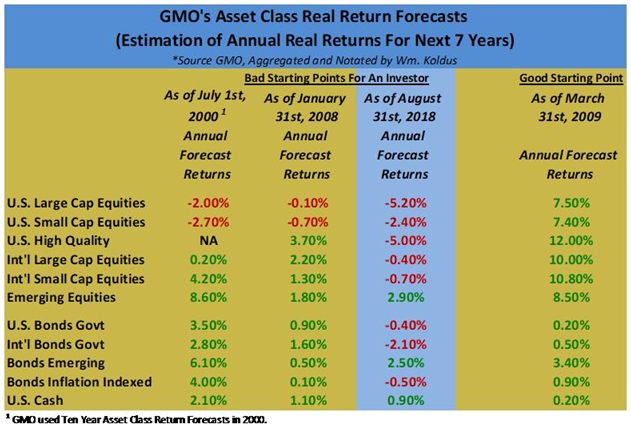
Having said that, projected real returns for the broader stock and bond markets are beyond abysmal today.
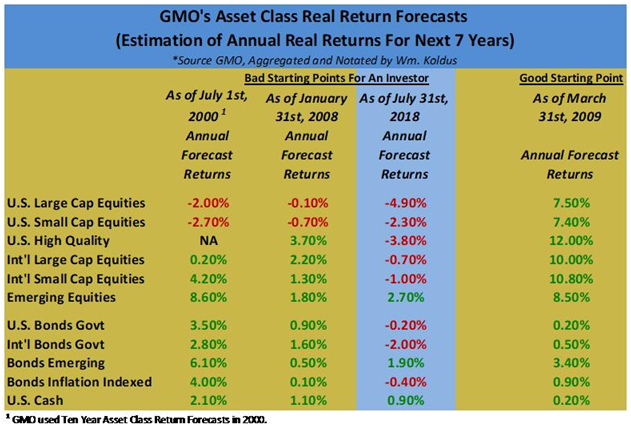
In summary, there really are only select pockets of value, and commodity equities are one of the sweet spots in my opinion.
Takeaway – Long Runway Still For Late Stage Assets
The Fed is farther behind in their rate hiking cycle than every before, and their glacial pace of interest rate increases in the current almost decade long equity bull market is a prime factor behind the price dislocations that we are seeing today.
Imagine for a second that monetary policy was normalized from 2009-2012.
Would we have the excesses and the imbalances that we have today?
Probably not.
However, you have to play the hand you are dealt.
Building on that narrative, the dislocations and dispersion in the financial markets the past decade is creating a Golden Age for active investors, as the supply/demand dynamics of many economically sensitive industries have been stretched to extremes, highlighting the importance of the capital cycle, and providing what I think are the investment opportunities of a lifetime.
Looking forward to what should be a dynamic rest of 2018,
Travis