Financial Markets Are At An Inflection Point

(Travis’s Note:  This article was originally published on April 24th, 2018, and it is being republished on October 28th, 2018, to add to the archives.)

  • For over nine years, the current bull marked has surprised investors and speculators, including me, with amazing twists and turns.
  • Personally, I benefited at the previous two major inflection points, (2000  & 2008), including making money in 2008, and making a small fortune in 2009 on the long side.
  • Lessons learned in 2008 & 2009, and during the prior 15 years actually created value biases in my investing style that impaired results tremendously in the current bull market.
  • The pain culminated in a horrific 2017 for me personally, which ironically had followed a historic rebound and reversal in 2016.
  • Almost everybody’s an expert today, with biases in their own successes over the current bull market, or over the past 20 years, but that market environment is rapidly coming to an end.

Few investors and speculators have had the highs, which included making money personally in 2008 followed by huge success on the long side in 2009, or the significant lows, including losing large sums of money personally and for individuals that I was/am very close to (there is nothing more torturous than believing in something through thousands of hours of research, sometimes tens of thousands of hours, and the market proving you wrong, and failing people who are close to you) that I have experienced in the financial markets.

I am over 40 now, and I have been investing for nearly 30 years, starting when I had a paper route at 9.  This has accumulated to a fairly large pool of experience.

However, that only tells half the story.  Financial markets, and market history have been a large part of my life beyond simply the years accumulated, as they have been both a passion and a hobby.

From the age of 12 to 15, I consumed every financial book I could find (really ever since that time frame I have been a voracious reader – this is my favorite financial book), and I began more actively investing and speculating in my early years of high school.

One of my favorite books from this time frame was Martin Zweig’s Winning On Wall Street, which was published in 1986.  During my formative years, I also read the Wall Street Journal, Barron’s, and Investor’s Business Daily, which was founded my William O’Neil in 1984.

During college, I switched from a career in teaching, following in the footsteps of my deceased father, into a career in Finance, after I turned a $3,000 student loan into over $300,000.  I spent every free minute or hour studying the markets, and I figured that I should make a career out of the profession, since it was something I had a unique passion for and where work felt more like a hobby.

Academically, I graduated Summa cum Laude, as the Top Finance student in my class, while working all kinds of jobs from resident assistant, to waiter, to hotel front desk worker, to an internship under a renowned value investor at an insurance company.

From there, I have held many licenses, and accreditation’s, including achieving the CFA Charter in 2006, and the CAIA Charter shortly thereafter.

Additionally, I have spent almost my whole adult professional career in the financial markets, working for Charles Schwab, then performing research as an investment analyst for an RIA, then working for one of the largest RIA’s in the country as a senior investment analyst.

Along this journey, I started a boutique invested firm with my own capital in 2009, I have helped to host investment conferences, and I have consulted for some renowned hedge funds.

Then, late in 2015, I founded “The Contrarian“, because I believed we were near another major inflection point.

In 2016, I was spectacularly right with this forecast.

Then, shortly thereafter, I was spectacularly wrong in 2017, where a huge curve ball was thrown by the markets, which has tested my spirit, persistence, and drive like few challenges in my life.

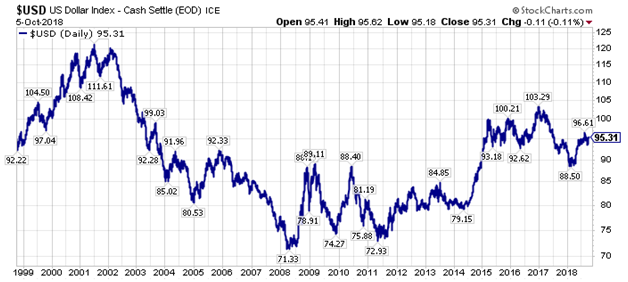
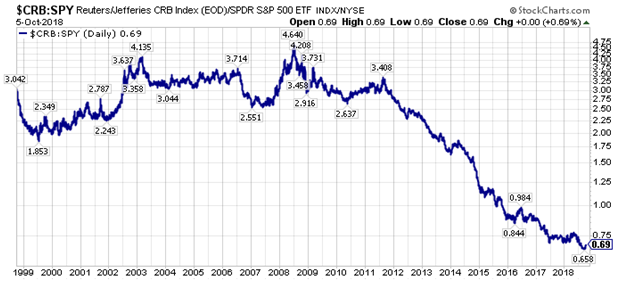
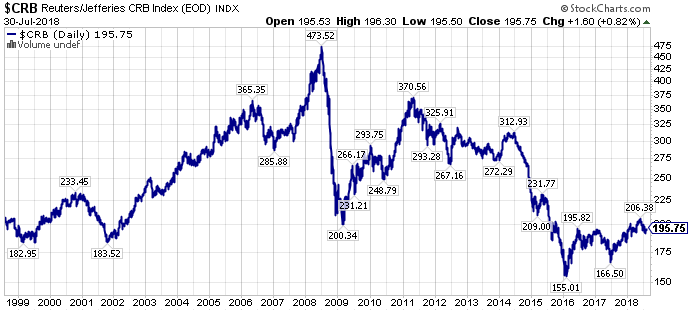
The financial markets are notoriously humbling, as life is, and 2017 humbled me mercifully, as investors went back into the same trades that excelled from early 2011 to early 2016, even though we had major secular turning points in 2016, including bottoms in commodity prices, including in oil, in interest rates, and a top in the U.S. Dollar.

In summary, the gravitational pull of the bull market was so strong, and so distracting, that it lulled everyone into thinking that nothing had changed in 2016, even though everything had changed.

Even more alarming, the increasingly rare events became prized as commonplace in the financial markets.

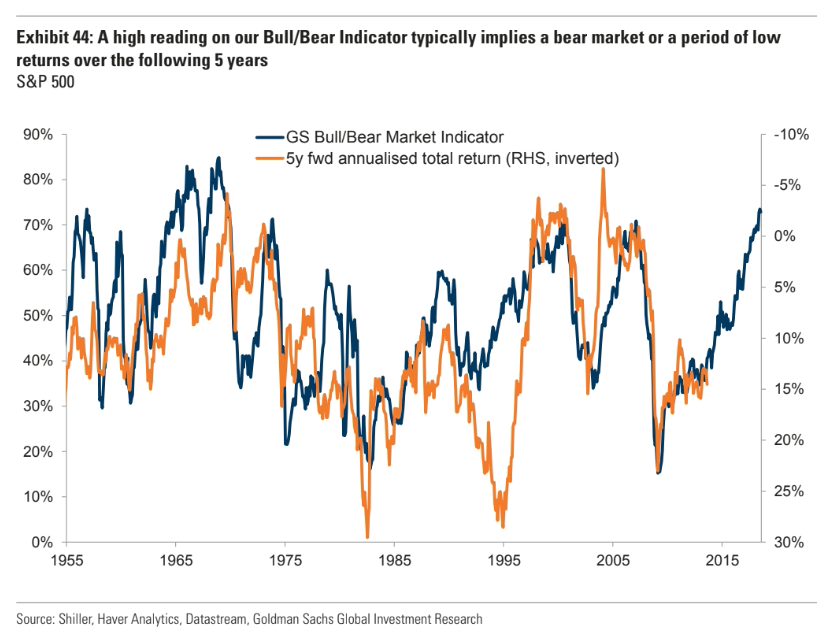
Building on this narrative, investors and speculators willingly ignored that valuations were at their most extreme levels in modern market history in the United States, investors and speculators willingly ignored some of the lowest volatility in modern market history, and investors and speculators willingly looked past the changes in market mechanics that were leading to anomalies that should not happen.

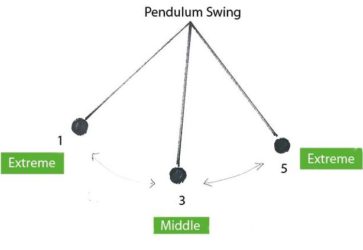
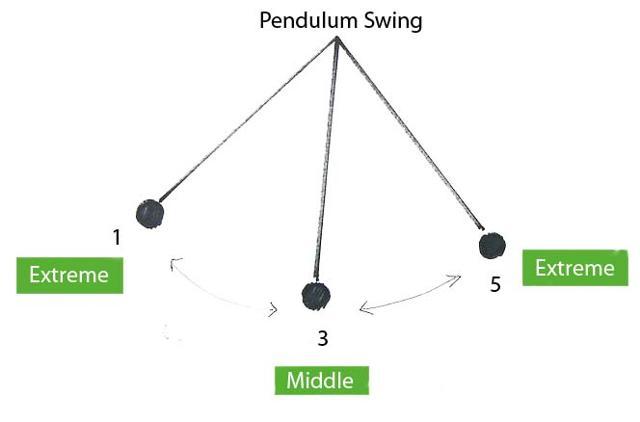
Ultimately, we have reached a rare point in the financial markets, similar to 1999 and 2000, where an investor can be, “Extraordinarily Bearish & Extraordinarily Bullish“, at the same time.

How does this happen?  The pied piper of the Fed and global central banks have certainly not helped, yet it is just the human condition, where we have all become accustomed to excessive speculation and extraordinary intervention in the financial markets.

Following the most improbable losses of my investing career in 2017, I believe there are extraordinary opportunities in today’s financial markets on both the long and short side.

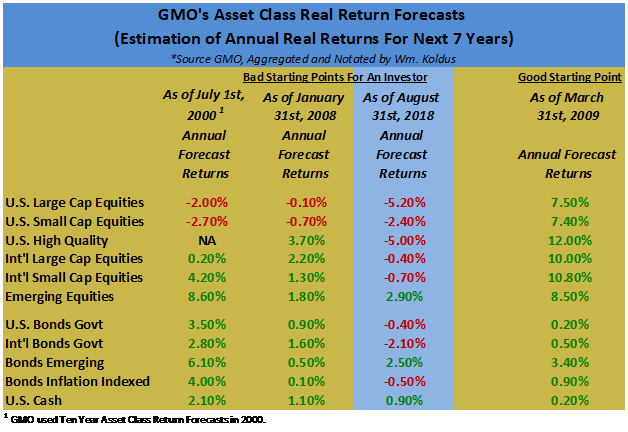
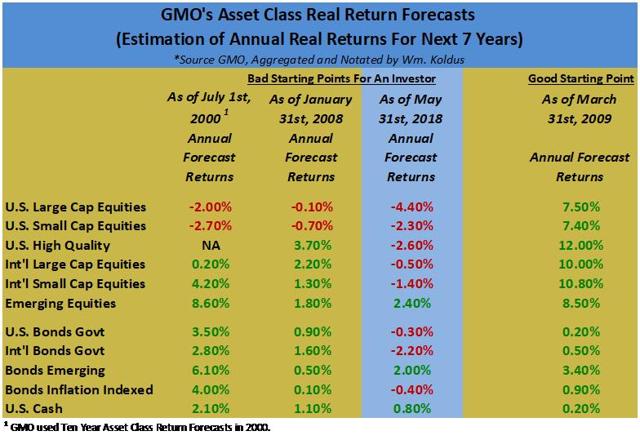
Thus, while most traditional investors could probably “Take A Ten Year Vacation“, and check in quarterly or annually to see if there are better opportunities, and most likely, come back to better prices a decade from now in the broader U.S. stock and bond markets, the landscape for contrarian value investors is unusually opportunistic, as most trades are extremely one-sided today, and when the pendulum swings the other way, it is going to be something we are writing about like we write about 1999-2002 and 2007-2009.

In closing, I have gone on several tangents, however, the main purpose of this blog entry is to highlight the opportunity, highlight the risks, and just reflect a little bit in a public forum where a dialogue can ensue.

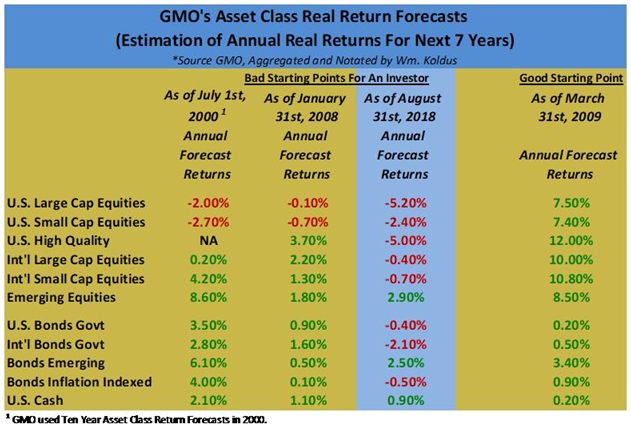
When the extraordinary happens over and over, it becomes routine in a sense.  Thus, for investors who have lived through the late 1990’s and early 2000’s, or those who survived and thrived from 2007-2009, today’s extremes seem commonplace, yet today’s extremes are even more extreme than those historic extremes.
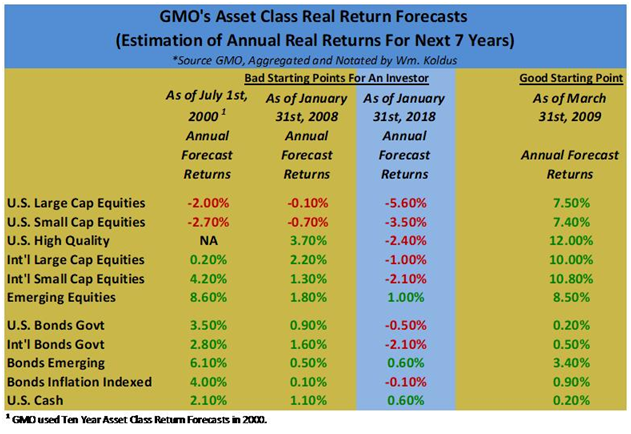
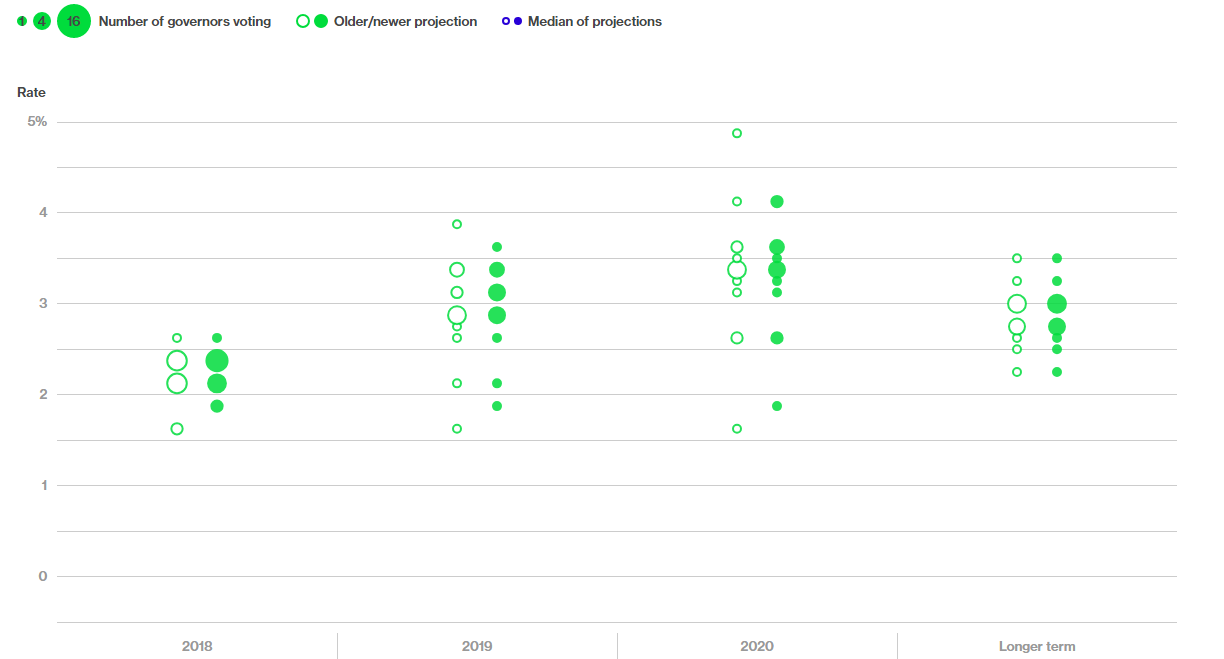
(Source: The ContrarianGMO)

Think about that for a minute.

If you take away anything reading this, be aware of the market extremes, be aware of your own biases, my own have been exposed and beaten down, and be aware of the historic risk, and the historic opportunity.

WTK

Disclosure: Every investor’s situation is different. Positions can change at any time without warning. Please do your own due diligence and consult with your financial advisor, if you have one, before making any investment decisions. The author is not acting in an investment adviser capacity. The author’s opinions expressed herein address only select aspects of potential investment in securities of the companies mentioned and cannot be a substitute for comprehensive investment analysis. The author recommends that potential and existing investors conduct thorough investment research of their own, including detailed review of the companies’ SEC filings. Any opinions or estimates constitute the author’s best judgment as of the date of publication, and are subject to change without notice.

Once In A Lifetime Market Price Action

(Travis’s Note: This article was originally published on January 22nd, 2018, which, with the benefit of hindsight, ended up being near the peak in the global equity market.  Much like 2000, though, when the NASDAQ peaked in March, then rolled over, however, the S&P 500 Index attempted to make a new high in the Fall of 2000, this time something similar happened, with global equities peaking in January, and then the U.S. stock market, specifically the S&P 500 Index, making new highs in the Fall of 2018).  

  • There is no parallel for today’s price action.
  • Extremes are beyond extreme.
  • There will be a price to pay when overcrowded trades unwind.

One of my favorite authors is Malcolm Gladwell.

One of my favorite short stories is Gladwell’s 2002 New Yorker article “Blowing Up“, about Nassim Taleb & Victor Niederhoffer.

One of my favorite passages (I have many) from this article is the following:

 Physical events, whether death rates or poker games, are the predictable function of a limited and stable set of factors, and tend to follow what statisticians call a “normal distribution,” a bell curve. But do the ups and downs of the market follow a bell curve? The economist Eugene Fama once studied stock prices and pointed out that if they followed a normal distribution you’d expect a really big jump, what he specified as a movement five standard deviations from the mean, once every seven thousand years. In fact, jumps of that magnitude happen in the stock market every three or four years, because investors don’t behave with any kind of statistical orderliness. They change their mind. They do stupid things. They copy each other. They panic. Fama concluded that if you charted the ups and downs of the stock market the graph would have a “fat tail,”meaning that at the upper and lower ends of the distribution there would be many more outlying events than statisticians used to modelling the physical world would have imagined.

Reflecting on a personal level, I have characteristics of both Taleb and Niederhoffer, and I have endured and caused a lot of pain in 2017, both daily , and on a cumulative basis.

Reflecting on the markets, we remain in an unnatural state, where the S&P 500 (SPY) has risen 15 straight months on a total return basis.

It is a melt-up of epic proportions, which comes after an already epic bull market, and the consistency of the advance for the broader market, and for the “Have” stocks (the “Have Not’s” have been left behind in an equally historic move) has removed any objectivity from analysts, speculators, and investors.

To close, we have to chronicle the magnitude and the extremes of the price action, and realize that when crowded trades unwind, there will be nobody else to take the other side of the trades.

Disclosure: I am/we are short SPY As A MARKET Hedge.

Additional disclosure: Every investor’s situation is different. Positions can change at any time without warning. Please do your own due diligence and consult with your financial advisor, if you have one, before making any investment decisions. The author is not acting in an investment adviser capacity. The author’s opinions expressed herein address only select aspects of potential investment in securities of the companies mentioned and cannot be a substitute for comprehensive investment analysis. The author recommends that potential and existing investors conduct thorough investment research of their own, including detailed review of the companies’ SEC filings. Any opinions or estimates constitute the author’s best judgment as of the date of publication, and are subject to change without notice.

Steepening Of Yield Curve Is Bigger Now (Already) Than In 2016

  • The U.S. Yield Curve has been flattening for a long time, and after a brief rise in 2016, the flattening trend resumed in 2017, and for a majority of 2018.
  • A recent steepening in they yield curve is already bigger than it was in 2016.
  • What does this mean for asset prices?

I have been a longtime bear on U.S. equity prices, and global bond prices, though I am extraordinarily bullish on a subset of equities that I think are historically cheap.

With regard to the broader U.S. equity market, my bearishness has been wrong, thus far (more on this below).

However, specific to the bond market, my public writing has proven fairly accurate, with the iShares 20+Year Treasury ETF (TLT) down -9.1% this year, and down -14.9% since July 1st of 2016 (global sovereign bond yields made their secular lows in the Summer of 2016), as evidenced by the following sampling list of my public SA articles.

Is Everything A Bubble? – Published On June 12th, 2017

A Massive Detour On The Road To Inflation – Published On March 24th, 2017

The Bond Bubble Is Bursting – Published On October 7th, 2016

Are We At The Point Of Maximum Financial Risk For Bonds? – Published On August 26th, 2016 (behind paywall)

The Bond Bubble Is About To Burst – Published On August 9th, 2016

Central Bank Bubble Blowing: The Reflation Trade Is Alive – Published On July 15th, 2016

The Irrational Fear Of Deflation – Published On June 17th, 2016

The Stock Market And Bond Market Are Telling 2 Different Stories – Published On April 8th, 2016

Inflation Is Coming, Are You Prepared? – Published On March 11th, 2016

Looking at the articles above, the last linked article, the Inflation Is Coming, Are You Prepared article,the The Irrational Fear Of Deflation article, and the Central Bank Bubble Blowing: The Reflation Trade Is Alive article, are all not behind SA’s paywall, so this could be a good starting point for reading.

Clearly, I have been bearish on bonds, and U.S. equities too, though so far this has been very wrong with regard to the broader U.S. equity market, though I still think real returns going forward are going to be the worst in modern market history as shown by the table I regularly put together below using data from GMO (first table below), and corroborated by Goldman Sach’s (GS) Bull/Bear Market Indicator (second chart below).

What could cause these poor projected real returns?

One answer is rising interest rates, and ironically higher economic growth, as faster economic growth puts upward pressure on inflation and interest rates, particularly at the longer-end of the yield curve, which has remain stubbornly subdued compared to shorter-term interest rates, as shown by the chart of the spread between the 10-Year U.S. Treasury Yield and the 2-Year U.S. Treasury Yield.

Looking at the chart above, we are clearly early in the steepening of the yield curve. In fact, the upturn only looks like a blip. However, in percentage terms, we have already exceeded the steepening in late 2016, so there may be more to this developing story than meets the eye, especially with the correlated turn higher in longer-term interest rates across the world, including in the United States, Britain, Germany, and Japan.

“Lower for longer” has been a mantra for a long time applied to interest rates, but what if after nearly a decade of a flattening yield curve, longer-term interest rates rise more than almost everyone expects right now?

What would that do to current asset valuations?

Where are the risks in an environment where almost all investors have been chasing yield for over a decade?

Where are the opportunities?

In closing, it is my opinion, that there are many extremely crowded trades, not to dissimilar to past major inflection points in the market that we have collectively witnessed as market participants over the past two decades.

Active investors, particularly value investors, have been punished severely the past decade, however, this pain (and I have endured my fair share or more) is setting up an extraordinary opportunity as price discovery, long cast aside by the indexing/ETF wave, reasserts itself with a vengeance.

Best of luck to everyone,

WTK


It Is Not Easy To Be A Contrarian, Especially At Turning Points

  • The most rewarding trading and investment opportunities happen when everyone is crowded on the same side of the boat.
  • Trades appear extremely crowded today, similar to how they were in 2016, though to a bigger degree.
  • Reflecting on past opportunities, and the time, patience, and losses that had to be endured to get to the other side of the opportunity.

Roughly two weeks ago, I had dinner with a friend, somebody I have known for over 35 years, really ever since we were five years old.  After the dinner/meet-up, I started to write this piece, but tabled it until this afternoon/evening.  During the get together, we reflected on the current environment, the challenges of the past two years, and the opportunity today.

Since this gentleman knows me pretty well, I made an effort to be quiet, and listen more than usual, and what came out caught my attention.

His observation is that whenever I have felt the worst (and these past twenty one months have been at the top of my list for difficult stretches in an active 25 plus year investment career), the weight of sub-par returns, the weight of losses, that is when things usually turned.

This gentleman knows very little about the markets (other than our interactions over two plus decades investing, and longer than that as friends), and what he reads on his own accord.  He also knows very little about the investment business, though he is very smart in his own right.  Really, he is just a good lifetime friend of mine, through the ups and downs, and he has trusted me to manage his capital.

Previously, I have lost significant amounts of money for him, and I have made him significant amounts of money (overall significantly net positive relatively, and absolutely, but he would be the first to tell you the ride has not always been smooth).  When things go badly, he trusts me, and when things go well, he trusts me too.  We have built up experience together that is invaluable.

Thinking about this dinner today with my friend, and thinking about this past week, and the past several years, starting with the founding of “The Contrarian” in December of 2015, it seems we are on the cusp of a significant inflection point.  Looking back, 2016 was the start, and while I have talked about how that year was not easy, it ultimately turned out to be a very good year for investment returns if you were willing to think different.

Besides being a good investment year for our fledgling group, though very few members were on board from the start (as most left earlier in 2016), 2016 saw a secular bottom in commodities early in the year, and then a secular bottom in the bond market, specifically a longer-term sovereign yields, which occurred in the middle of 2016.

Interestingly, the second half of 2016 looked a lot like today’s investing environment, with longer-term yields rising, U.S. commodity equities outperforming, and ironically the U.S. Dollar rising, though interestingly today, the U.S. Dollar Index is much lower than its previous peak in 2016, or really where it was from 2015-2017.

The inability of the U.S. Dollar Index to make a higher high is a big positive, in my opinion, especially for commodities, commodity equities, and international equities, which have lagged U.S. returns badly over the last decade.

2017, and a majority of 2018 clouded and obscured the picture that was painted so beautifully in 2016, yet after a long detour, we appear to be back on the road.

How will the rest of the inflection point play out?

The specific details, I do not know exactly (though I have my general road-map).  This is similar to past major inflection points.  Looking back, a lot of things that happened in 1996-2002, or in 2006-2010 surprised me, though having the bigger picture road-map/game plan proved invaluable.  Ultimately, if you are right, and able to stick to it, having a bigger thesis can be very rewarding.

Reflecting on the past opportunities, another thing that stands out to be is resilience.  For some of my best years/returns in the market, things did not always work out as planned.  Sometimes I endured significant losses before the turning point, sometimes I had to commit additional capital, and sometimes I just made, and still do make, mistakes.

However, being resilient, and sticking to something with perseverance, when you think you have an edge can payoff with rewards that are hard to imagine, if you are positioned correctly, and aggressively, which of course has risks, and which of course is not easy.

So, what should we stick to today?  What is our primary investment thesis today?  This linked article will summarize it nicely.

A further simplification can be explained in few sentences.  Specifically, bonds topped first (2016, and I believe this is confirmed now with the very recent steepening of the yield curve), stocks will top next (there is a contingent of smart investors that I interact with that believe this has happened already on global basis, though I am not in that camp yet), and then commodities last.

Over the past several weeks, we are seeing this thesis play out in real time, as longer-term sovereign yields are rising, led by U.S. yields, yield curves are steepening, and commodities are outperforming, with oil up four straight weeks to new highs being the most notable example, however, there are many other examples, including natural gas, which might be the most crowded trade in the market I see today (almost every market participant believes U.S. natural gas prices will be lower for longer, ironically while world natural gas prices surge).

In summary, the runway for commodity, and commodity equity out-performance should still be long, as we have not seen a capital rotation yet, though the seeds for this capital rotation have been planted.  Lower for longer is currently being challenged as interest rates normalize across the curve, first in the United States (and first at the short-end of the curve, but now at the longer-end), and soon the rest of the world will follow, as Europe and Japan are already both reducing their quantitative easing.

Keep this thought in mind, and keep repeating it.  Bonds will top first, then stocks, then commodities.

With equity markets in the U.S. poised for some of their worst real returns in modern market history, the relative and absolute opportunities should be every bit as big as they were in 2007-2010 or in 1999-2002.

In closing, stay resilient, keep developing your ability to think about the next opportunity after a success, or more importantly after a mistake, and keep your minds focused on enormous relative and absolute opportunities, which as the chart below shows are in commodities versus the S&P 500 Index (SPY), with commodity equities representing an even better opportunity, in my opinion.

I have a number of things I am working on research wise, including a new Top-Ten List.  After the turning point in April through June, July and August were a cruel return to purgatory, the proverbial “Lucy” taking the ball away from “Charlie Brown” one last time (hopefully one last time) as he prepared to kick it, and frankly, I couldn’t publish a new Top-Ten List, as it was just an open wound.  As painful as it is, there is going to be a time where all the suffering is worth it, and I am increasingly confident that we are closer to that point today,

Travis

The Wrong Signal

Brief Intro Note From Travis

While the Fed has 5-6 more interest rate hikes projected to get back to the projected neutral Fed Funds Rate according to the Fed’s Dot Plot, which is at the low end of historical neutral rates, the financial market is going to force the Fed to pause in their rate hiking campaign.

How?

The Fed is not going to invert the yield curve, and the market is going to force the Fed’s hand, providing a tailwind for an unexpected market development, which is the return of sustained inflationary pressures.

Thesis

The Fed will not invert the yield curve intentionally, and this reluctance will cause the Fed to settle at a lower Fed Funds Rate, at least temporarily, providing a continuation of historically accommodative monetary policy.

Setting The Stage – The Market Is Going To Force The Fed’s Hand

Right now, the market is pricing in a 99% chance of the Fed raising the Fed Funds Rate from a range of 1.75%-2.0% to 2%-2.25% at their September 2018 meeting.

Additionally, the financial markets are pricing in a 67% chance that the Fed will raise the Fed Funds Rate an additional quarter point at their December 2018 meeting to a range of 2.25%-2.50%.

So far, so good, according to market expectations.

However, looking out a year from now to September of 2019, there is only a 37% chance, according to the financial markets, that the Fed will raise rates one more time to the 2.50%-2.75% Fed Funds Rate target range.

Additionally, looking at the table above, there is a higher percentage chance, according to the financial markets, that the Fed will not raise rates one single time from December of 2018 all the way through September of 2019, versus the Fed raising rates twice.

Building on the narrative even further, the financial markets are pricing in a higher probability of a cut in the Fed Funds Rate in 2019, after the December 2018 Fed Funds Rate increase, than three Fed Funds rate hikes in 2019.

Market Expectations Do Not Square With The Dot Plot

While the financial markets are current predicting three more rate hikes in total through September of 2019, the Fed’s most recent Dot Plot showed four rate hikes in 2018 (two more to go) and an additional three rate hikes in 2019.

Clearly the market is much more pessimistic than the Fed’s own projections for their path of interest rates.

Why is this the case?

Yield Curve On The Cusp Of Inverting

The answer as to why the market’s expectations of future interest rates is more pessimistic than the Fed’s can be found in the yield curve.

Specifically, in the United States, 2-Year Treasury Yields have kept on rising, and remain near their recent highs.

However, 10-Year U.S. Treasury Yields have retreated from their recent highs, as the fears of higher long-term interest rates that were prevalent near the beginning of 2018, have receded.

With 2-Year Treasury Yields continuing to rise, and 10-Year Treasury Yields retreating, the yield curve has flattened significantly.

Putting it all together, market participants almost all know that an inverted yield curve has been a marker for a future recession, with a lead time of roughly 18 months.

Thus, we are in an investment landscape where most investors and speculators are casting a wary eye to the future, believing a recession is around the corner.

The Wrong Signal

The yield curve is flattening, and most investors and speculators are trying to make sense of this development.

This price action has obscured something remarkable.

Specifically, under a rules based approach, the Fed Funds Rate should be much higher.

More specifically, under the Taylor Rule, which is shown in the blue line in the above graph versus the actual Fed Funds Rate in depicted by the red line, the Fed Funds Rate under a rules based approach is targeted at 7.5%.

Before dismissing this analysis reflexively because of the level of the forecast, look how closely the Taylor Rule implied Fed Funds Rate tracked the actual Fed Funds Rate from 1980-2000.

Why is the Taylor Rule suggesting such a high Fed Funds Rate?

Two answers come to mind.

First, even though the current economic recovery dating to June of 2009 (for reference the U.S. stock market actually bottomed in March of 2009) has been anemic, averaging 2.2% Real GDP Growth, which is the second-worst growth rate for an economic expansion in the post-WWII era, the extraordinary length of the expansion has provided a cumulative economic growth that is greater than most market pundits, including myself, give the market credit for, and this cumulative growth has started to register on capacity restrained barometers.

Second, economic growth has picked up noticeably with the initial readings for Q2 2018 U.S. Real GDP Growth posting a 4.1% growth rate, noticeably above the Real GDP Growth Rate in this expansion.

Adding to the narrative, Real GDP Growth is picking up further, with the Atlanta Fed GDP Now Model back up a 4.6% Q3 2018 Real GDP Growth rate reading.

For all its criticisms, the Atlanta Fed GDP Now Model has been more accurate than the Blue Chip economists consensus forecast over the past six months, as the Atlanta Fed GDP Now Model, does not have the biases that human forecasters do, including myself, so if there as truly been a change in the growth paradigm, an unbiased model is likely to capture this change earlier.

Takeaway – Market Is Mispriced

The bond market, stock market, and commodities market are priced for pessimistic growth right now.

The Fed Funds Rate futures market does not even believe the Fed’s own forecasts right now about future interest rates or economic growth.

Historically, where the Fed has been more wrong than right with their forecasts, particularly at inflection points, we can understand the market’s hesitation.

Wait, but isn’t the U.S. stock market at record levels?

Yes.

However, the U.S. stock market has become a “safety trade” for global capital flows over the past decade.

Thus, stock markets outside the U.S. are painting a different picture of performance.

Additionally, below the surface of the U.S. stock market, economically sensitive equities, including many of our favorite targeted equities right now, have had abysmal relative, and absolute, performance over the past decade.

Why?

Economic growth has been disappointing in the United States, relative to past economic expansions over the past decade, and economic growth globally has been disappointing relative to expectations.

However, what if economic growth has finally reached a cumulative level of expansion after roughly a decade of GDP growth, that we are on the verge of triggering a traditional late-stage capital rotation?

Summarizing, for someone who nailed the potentially secular turning points in bonds and commodities in 2016, and who was rewarded for it handsomely, the last twenty months have been more difficult that almost any investing environment I have been through over the past 25 years, as there simply has not been uptake, or follow-through with regard to economically sensitive equities, particularly those value-oriented equities that should benefit the most from a turning point in economic growth expectations

The upside today is trades are more crowded than even 2016, as almost everyone believes in a uniform outcome in the financial markets, yet what if we are finally at the destination, after a very long journey, that demand is outstripping supply on a sustainable basis, and what if economic growth is actually accelerating, not rolling over?

Is the possibility of this scenario even priced in by the markets?

Even if the more modest projections of the Fed are more accurate than the markets current projections, what asset classes would benefit?

The more I think about it, the stage is set for the shunned equities of the past decade, notably commodity equities, international equities, and emerging market equities, to excel going forward.

The curve-ball of July and August of 2018, when liquidity conditions were supposed to permit a rally in risk assets, yet the safe-haven assets outperformed even further, was one of the market’s financial acts of deception, from my vantage point, eschewing investors from the very trades that are set to thrive.

To close, ironically the market is setting up a scenario where the market constrains the Fed, causing the Fed, at a minimum, to pause in their interest rate hikes, and more likely causing the Fed to settle at a terminal Fed Funds Rate in this this rate hiking cycle that is much easier, in-terms of monetary policy accommodation, that past Fed Funds neutral rates.

With the market potentially constraining the Fed, forcing an easier than normal monetary policy, the odds of higher economic growth actually increase, which would further benefit the downtrodden economically sensitive equities and inflation sensitive equities, both of which have been cast aside.

Interested to see if we can get a good discussion going on this,

Travis

Growth Stocks Trouncing Value Stocks

Introduction

This weekend, I was putting together performance data (more to come on this front shortly), and the continued out-performance of growth equities was noticeable enough that I decided to pen an article for members about it.

Going back a decade, growth stocks have trounced value stocks in the United States, and the longer-term out-performance of growth stocks over their value counterparts is eye-opening.

Thus, I wanted to highlight the performance differential, to explore what it means, and contemplate how it will be resolved.

Growth Is Outperforming Year-To-Date

Compared to a historically low equity volatility year in 2017 (really almost all financial assets had low volatility in 2017), volatility has certainly picked up in 2018.  However, that has not impacted the out-performance of growth equities, yet.

Year-to-date in 2018, the iShares Russell 1000 Growth ETF (IWF) is higher by 12.3%, significantly outpacing the returns of the iShares Russell 1000 Value ETF (IWD), which is higher by 1.7%.

Looking at smaller capitalization equities, the same trends are holding true, with the iShares Russell 2000 Growth ETF (IWO) higher by 13.3% year-to-date, while the iShares Russell 2000 Value ETF (IWN) is higher by a still healthy 7.5% year-to-date through Friday, August 10th, 2018.

There is no question that growth stocks continue to lead their value counterparts in 2018.

This trend has persisted for roughly a decade, with sporadic periods of value out-performance, including most of calendar year 2016, yet these periods of value out-performance have been false starts thus far.

Growth Is Outperforming The Past Decade

Going back ten years, the iShares Russell 1000 Growth ETF has increased 215.6%, while the iShares Russell 1000 Value ETF is higher by 126.2%, which is not to shabby on an absolute basis, or even a relative basis compared to most international and emerging market equity ETF’s, yet the performance differential versus the Russell 1000 Growth is historically wide.

This performance differential persists in the small-cap arena too, with the iShares Russell 2000 Growth ETF higher by 189.5% over the prior decade, while the iShares Russell 2000 Value ETF is higher by 138.7%.

Interestingly, the performance gap between the Russell large-cap growth and value ETF’s, which stands at 89.4% over the last ten-years, is larger than the the performance gap between the Russell small-cap growth and value ETF’s, which have a 47.8% performance differential.

Clearly, the Russell 1000 Growth ETF has been positively impacted by the historic run in mega-cap growth stocks, including Amazon (AMZN), which is up 2242.9% over the past decade, Apple (AAPL), which is up 866.8% over the past decade, Alphabet (GOOGL), which is up 405.6% over the past decade, Microsoft (MSFT), which is up 397.8% over the past decade, and Netflix (NFLX), which is up a remarkable 7697.4% over the past decade.

On this note, one of my biggest mistakes in what was a wonderful 2008-2010 time period for me personally investment wise, was not identifying what was rare, which was growth, in a low growth world.

Elaborating further, I had invested substantially in the first video streaming company that I am aware of, which was Intraware, in 1999, so I saw the potential for a stock like NFLX, yet while NFLX was playing out in front of my eyes, my value bias prevented me from investing in what was a phenomenal growth opportunity.

Recent Small-Cap Out-performance Holds Clues 

If you are a market historian, you know that the best long-term asset class, in terms of performance, is small-cap value.  The Ibbotson data, which is now part of Morningstar, illustrates this clearly.

However, looking at the data above, small-cap value stocks, as measured by the Russell 2000 Value ETF, are the second worst performing group over the past decade, trailing large-cap growth equities, small-cap growth equities, and only moderately ahead of large-cap value stocks, as measured by the Russell 1000 Value ETF.

Thus, small-cap value stocks (incidentally many of our favored U.S. commodity equities, which are illustrated on the Top-Ten List, are now classified as small-cap value equities) are due for a period of out-performance, which would be in sync with the long-term Ibbotson data.

Somewhat surprisingly, given the perception of today’s stock market leadership, U.S. small-capitalization equities have out-performed their large-cap counterparts year-to-date in 2018 as shown above.

This raises some interesting questions, which I am brainstorming out loud as follows:

  1. Perhaps the U.S. stock market is not as near rolling over as believed, or as projected, as a resurgence in U.S. small-cap equities would not align with the narrative of narrowing market leadership?
  2. Perhaps we have not reached the late-stage cycle of the investment cycle road map?

For someone who has believed that the current U.S. equity market is historically overvalued, specifically even more overvalued than 1999 or early 2000, I am trying to think outside-the-box to see how the current high valuation investing could be resolved.

Look For A 2000 Repeat Of Value Over Growth

This past week, I officially turned 41, and looking back to 2000, when the Russell 1000 Growth and Value ETF’s were just formed, I am officially feeling older.

As you can see from the charts above, the Russell 1000 Growth & Value ETF’s came out in late May of 2000.  From late May of 2000, through year-end 2000, the Russell 1000 Growth ETF was down -17.2%, while the Russell 1000 Value ETF was higher by 8.6%.

From memory (the Russell 1000 Performance calculator will verify), the Russell 1000 Growth Index finished 2000 lower by roughly -22%, while the Russell 1000 Value Index finished higher by roughly 7%.

Thus, in one year, a significant portion of the growth minus value performance gap, that had built up over the prior decade, from 1990 to 1999 was erased.

Building on this narrative even further, the 2000-2002 bear market in U.S. equities, which saw the S&P 500 Index (SPY) decline by roughly 50% from peak to trough, occurred alongside a very mild recession.

Could something similar happen today?

Going even further, could we see the S&P 500 Index, and more specifically the historically outperforming growth equities, decline substantially outside a recession, or even if economic growth picks up?

Takeaway – Growth’s Run Over Value Is Getting Long In The Tooth

Growth stocks have dominated value equities over the past decade.

This has emboldened growth investors, and taken the spirit out of value investors.

The comparisons between today’s market environment, and the one that existed in the late 1990’s is apt, and this is coming from someone who was an active, contrarian value investor in both time periods.

Both growth and value investors should be on the lookout for a reversion-to-the-mean in performance.

When this inevitably happens, I think the performance-gap between growth and value investments will be bigger, in-favor of value, than it was from 2000-2002.

Turning Points Take Significant Time

  • Inflection points develop slowing, building like a kindling fire, before the flames erupt.
  • Similar to a big ship, broad market inflection points take significant time.
  • Price action continues to suggest that a major turning point is at hand, however, this has not been confirmed yet.

Intro Note From WTK

We have had two major inflection points in the broader markets in the past 20 years.  Specifically 1999-2003, and 2007-2010.  These years spanned dynamic changes in investment prices, with overvalued investments plunging while undervalued securities found a bid in both scenarios, and these selected years framed time spans where asset allocation and security selection really mattered.  Right now, I think we are in the midst of our third major inflection point in the last 20 years.

Building on this narrative, prospective future real returns for developed market equities, specifically U.S. stocks and U.S. bonds, look more dire today than they did at the beginning of 2000 or 2008.

We can go back, with the benefit of hindsight, and make fun of, or objectively criticize firms like GMO all we want for their prior real return forecasts, however doing that (the criticizing) ignores that their forecasts, and others with a valuation bent, are based on an underlying valuation methodology, and valuation still matters in the end.

Put simply, starting from one of the highest starting points in market history in terms of valuations, adjusted for record profit margins, means that an investor today in U.S. stocks and U.S. bonds has very little probability of generating healthy future returns, until the starting point is more favorable.  Going further, generating positive real returns over the next decade in the broader U.S. equity market may be a bigger challenge than many investors realize.

Adding to the narrative, it appears that we are in the midst of a secular turning point in bonds, as I have written about in-depth in my member Eye On The Bond Market series where the 35 plus year bond bull market is sovereign bonds came to an end in 2016.

The bottom in bonds, which occurred in the middle of 2016, occurred after a bottom in commodity prices, which occurred near the beginning of 2016.

So far, the potential 2016 secular bottoms in commodity prices and sovereign bonds are acknowledged, however, they are not widely embraced, as there remains a lot of skepticism and pessimism among investors and speculators.

This pessimism and skepticism is prevalent, in part, because the market leaders during the length of the current bull market have remained in-favor, with notable strength in the FAANG and large-cap growth equities this year.

Building on this narrative, large-cap growth stocks are at the tail-end of a decade long run, so it would not be surprising for the top in the large-cap growth leaders to coincide with the top of the current equity bull market.

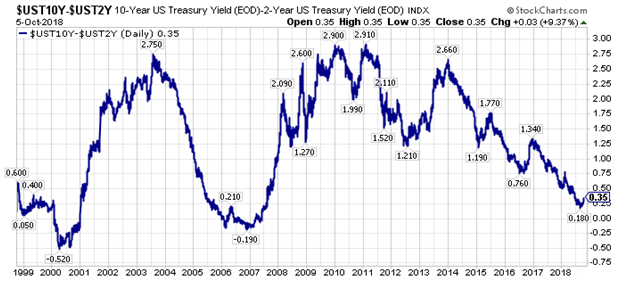
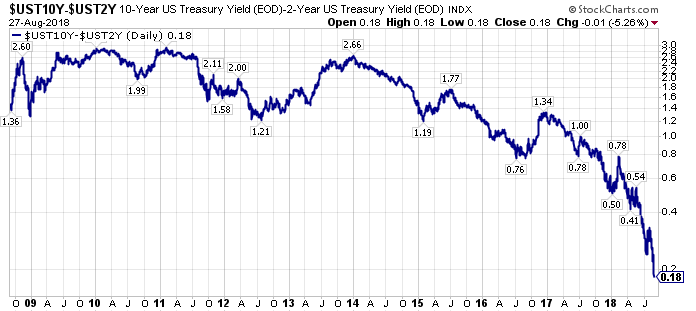
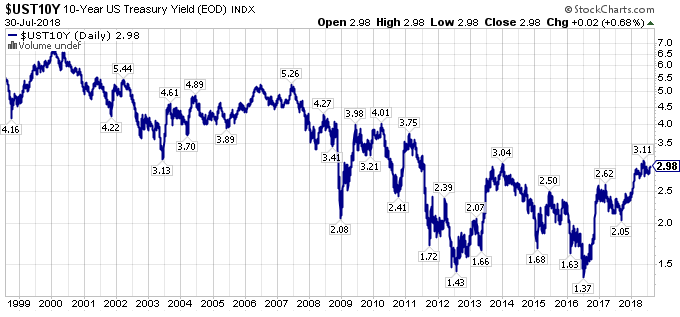
With bonds topping, equities are on the clock to top next, though given the dynamics of the current global business cycle, the topping process could be elongated to an extreme degree, a potential extension (on steroids) of the 2000 topping process.

Wrapping up this introduction, we should be in the sweet spot for inflation sensitive assets to outperform, and that has indeed been the case since January of 2016, yet right now, market leadership remains a clouded picture, so a majority of investors and speculators have not yet adapted to the new investing landscape.

In my opinion, that capital rotation recognition point is coming, and when it arrives, we should see even stronger price moves than we saw in the historic reversal and rebound in 2016.

FAANG & Large-Cap Technology Leadership – Beginning Of The End

Price action in the markets was interesting at the end of last week (when I started to write this article…I am now finishing it up Monday evening), and this interesting price action continued today.  Could we be at the beginning of a long awaited capital rotation?  Only time will tell.

Last week, the S&P 500 Index (SPY), registered its 4th straight week of gains, but market leading stocks like Facebook (FB), Intel (INTC), Netflix (NFLX), and Twitter (TWTR) showed cracks in their armor.

The selling pressure in the large-cap technology leaders escalated today, Monday, July 30th, as the following charts show.

Year-to-date in 2018, FB is now down -3.1%, Intel is higher by 4.6%, Netflix is higher by a still remarkable 74.5% in 2018 (NFLX was higher by roughly 120% at one point), and TWTR is up by 30.7% YTD in 2018, after being higher by over 90% at its 2018 highs.

Three stocks have accounted for a substantial majority of the S&P 500’s 5.8% 2018 gain through Monday’s close.

These stocks are Amazon (AMZN), Microsoft (MSFT), and the aforementioned NFLX.  AMZN’s shares are up 52.1% YTD through Monday’s close, and MSFT’s shares are higher by 24.3%.

AMZN and MSFT shares both remain in strong up-trends, thought the recent weakness in the NASDAQ, and in large-cap technology stocks, has hurt the relative strength of both equities.

Ultimately, the Invesco QQQ Trust (QQQ) is still higher in 2018 by 12.9% as of this writing, down from its earlier 18% gains, yet still higher than the comparative return of the S&P 500 Index (up 5.8%) or the Dow Jones Industrial Average (DIA), which is up 3.4% in 2018 YTD.

Will 2018 resemble the technology peak of 2000?

There are certainly similarities, with loved market leaders that couldn’t possibly decline substantially (could they?), and a decade of growth out-performance in the rear view mirror.

Commodity Stocks Still The Intermediate-Term Leaders

As strong as FAANG equities, particularly Amazon and Netflix have been, they still trail the best performing commodity equities since the start of 2016, as the following chart illustrates.

Stocks like Teck Resources Limited (TECK), which is Canada’s largest natural resource company, Vale (VALE), and U.S. Steel (X), have outpaced the performance of AMZN, and NFLX shares by a wide margin, which is saying something.

Now, not all commodity equities are up to the same degree, and some energy equities are even lower, however, this is a opportunity, in my opinion, as commodities, and commodity equities are the broader market’s performance leaders since the start of 2016.

The Takeaway – Commodity Stocks Remain Insanely Cheap On A Relative & Absolute Basis

Despite the secular bottom in commodities, commodity equities, and sovereign interest rates in 2016, and the out-performance of commodity equities, particularly base metal stocks, as shown by TECK, VALE, and X earlier, and also by the SPDR S&P Metals and Mining ETF (XME), illustrated in the first chart below, since the start of 2016, commodity equities have struggled in the bigger picture.

Looking back over the past 10 years, the performance of XME, the Energy Select Sector SPDR Fund (XLE), and the SPDR S&P Oil & Gas Exploration & Production ETF (XOP), which have returned 28.9%, -13.1%, and -46.0% respectively, have dramatically trailed the performance of SPY and QQQ, which have delivered total returns of 178.7%, and 334.2% respectively.

Widening the lens even further to 20 years, reveals something even more interesting.

Specifically, the large-cap energy equities represented by XLE, think the Exxon’s (XOM) and Chevron’s (CVX) of the energy space, have kept pace with the QQQ, as XLE has returned 349.7% over the last 20 years, slightly trailing QQQ’s total return of 377.2%.  Both have outpaced the S&P 500 Index, which has returned a not too shabby 256.1% total return over the last 20 years.

Thus, large-cap energy equities have excelled, while their smaller capitalization brethren, as represented by XOP, have struggled mightily, though the small-cap energy equities have outperformed the base metal and mining equities of the XME.

Looking at the performance data, there is a clear value delineation, ordered by market capitalization in the commodity equity universe.

This is why a stock like Southwestern Energy (SWN), which remains a top-five U.S. natural gas producer (and one of the most undervalued equities in the market today IMO), yet SWN has clearly been part of the Have Not group of equities, as evidenced by its market capitalization, or Cleveland-Cliffs (CLF), which I also believe remains very cheap on a relative and absolute basis, yet CLF shares remain extremely out-of-favor, remain so attractive.

These are the quintessential value stocks of today, the proverbial REITs of the late 1990’s.

It is easy to forget now, but entering the year 2000, technology stocks had ruled for the prior decade, and they started the year strongly.

Does that sound like the past decade to you?

It should.

What happened next.  Well technology stocks topped in March of 2000, and the Russell 1000 Growth Index (IWF) went on to lose roughly -22% for calendar 2000, while the Russell 1000 Value Index (IWD), which had trailed in performance for the prior decade, actually delivered a positive return in the year 2000, gaining roughly 7%.

The performance difference was even greater in the smaller capitalization equities.

Value is due for a period of performance like this versus growth, and the key question is what are the best value stocks today.

Could the best value stocks actually be the downtrodden, out-of-favor commodity equities?

I think it is more likely than most market participants think.

Looking forward to a good discussion on this topic,

Travis